Freschia Gonzales of Benefits and Pensions Monitor reports a winning portfolio can still look like a loser, CPP Investments warns:
CPP Investments argues that beating a benchmark no longer measures whether a portfolio is working.
Its
modelling shows a diversified pension fund can trail its market
benchmark almost 30 percent of the time over a decade, even when its
underlying strategy genuinely adds value.
That
figure comes from a July 2026 paper from the CPP Investments Insights
Institute, the second in a series on the total portfolio approach
(TPA).
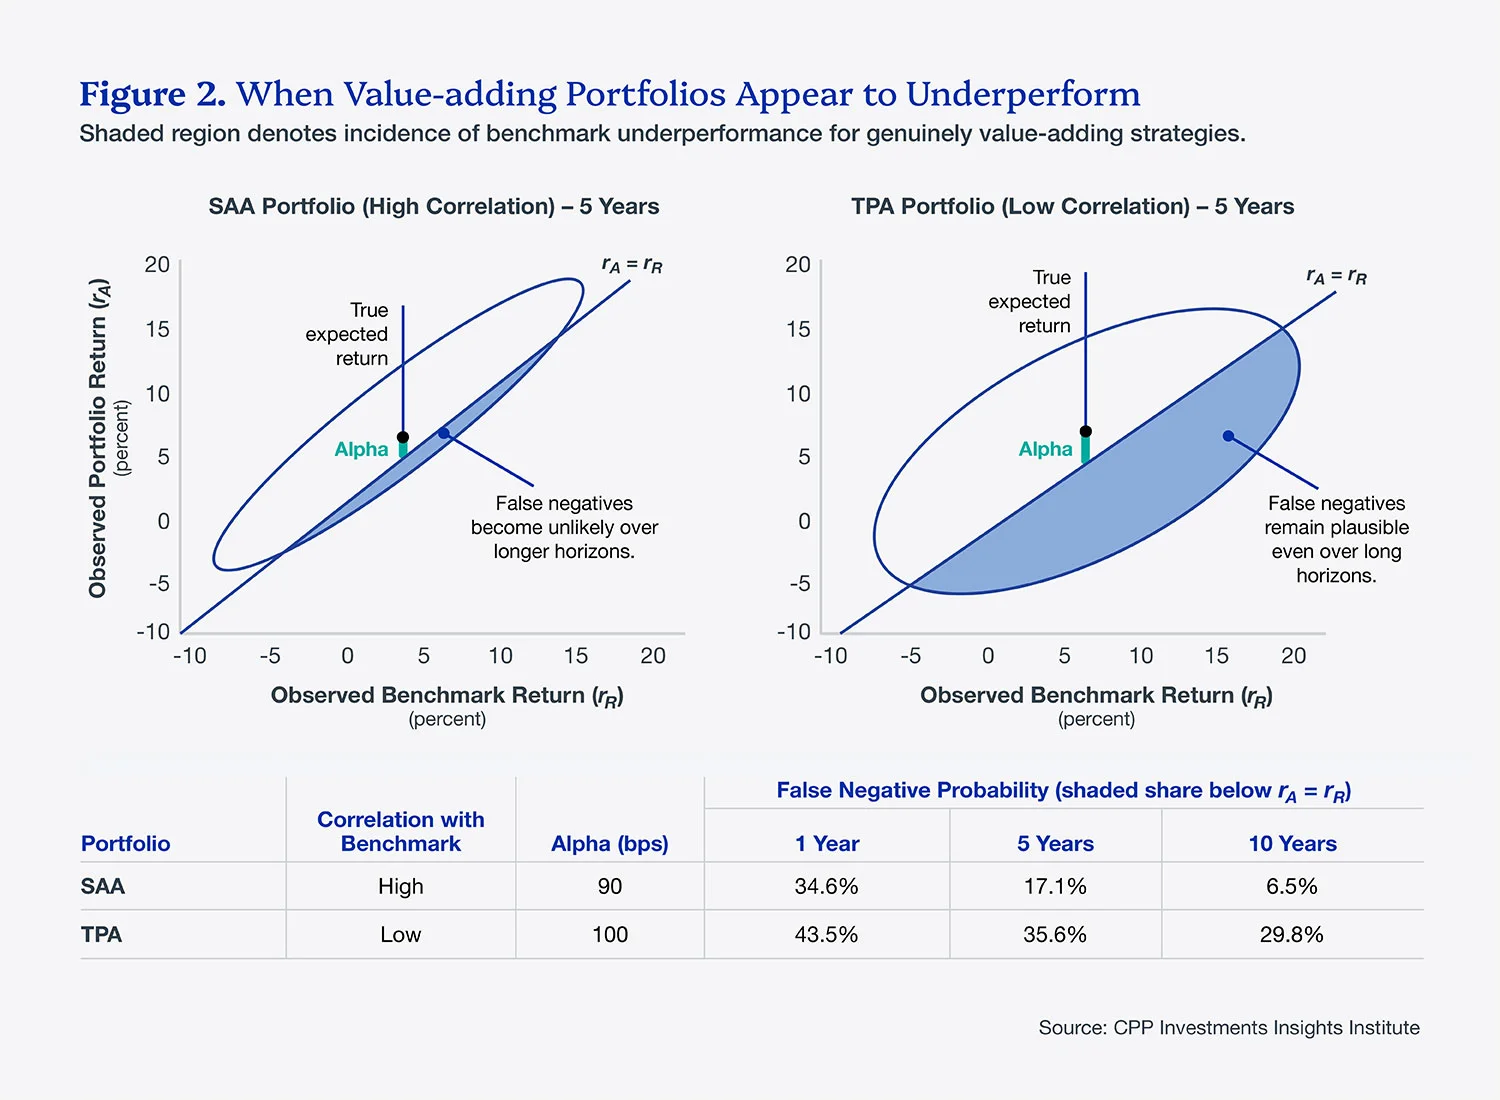
In
a stylized illustration, the authors modelled two portfolios carrying
the same total risk: a strategic asset allocation (SAA) portfolio highly
correlated with its benchmark, and a TPA portfolio built to diversify away from it.
Even
with a higher expected value-add of 100 basis points, the diversified
portfolio showed a 29.8 percent chance of underperforming its benchmark
over 10 years, the report said, compared with 6.5 percent for the more
benchmark-hugging design.
These are false negatives, cases where a sound portfolio looks like it failed.
The paper frames the problem as one of accountability outgrowing its measuring stick.
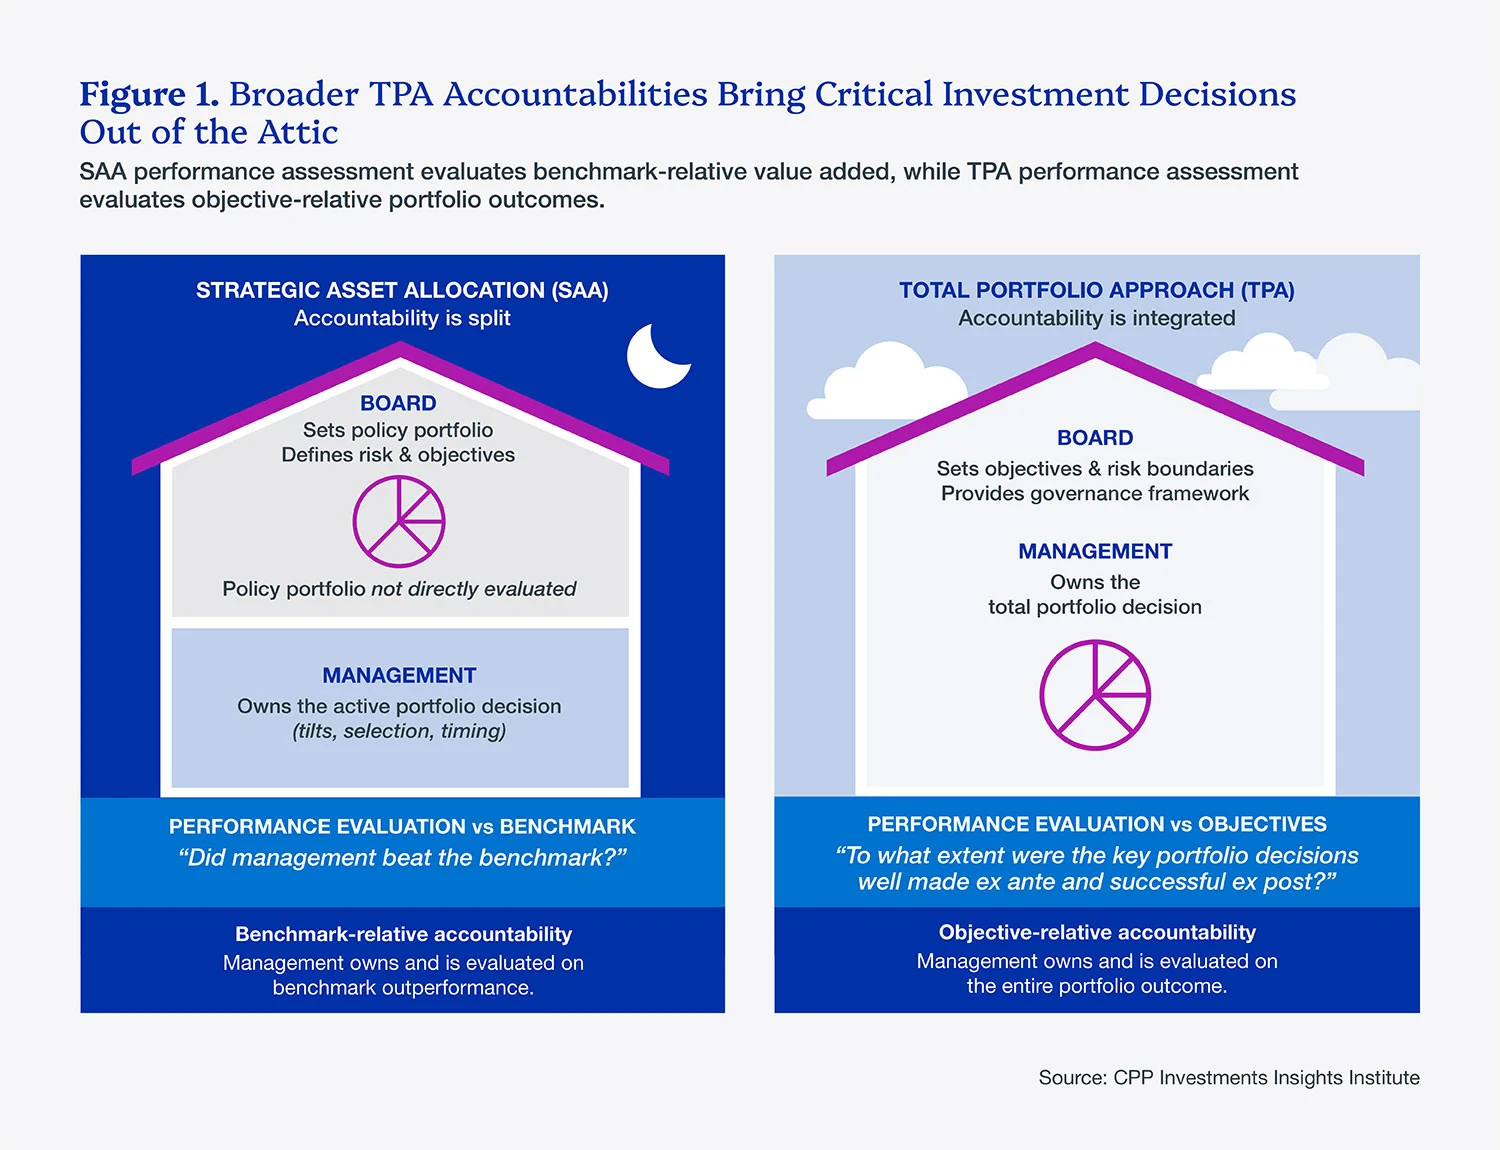
Under
traditional SAA, the report explained, a board sets a
policy portfolio and management is judged on whether it beats that
benchmark.
Under TPA, management instead owns a broader set of interconnected choices, including how much risk to take, how to diversify, how to balance liquidity, and how to implement, and all of those decisions fall within the scope of performance assessment.
CPP Investments set out three reasons a single benchmark falls short.
First, the authors noted, short-term outperformance or underperformance often reflects luck rather than skill, a problem amplified when a portfolio is intentionally built to differ from its index.
Second,
benchmarks drift: as market concentration rises,
capitalization-weighted indices can take on exposures managers never
intended to hold.
The
report pointed to research by Sorensen, Alonso and Belanger describing
this as a benchmark's "chameleon" nature, which it said can reward
concentration when concentration is winning and penalize diversification held for long-term resilience.
Third,
as portfolios add private assets, illiquidity premia and long-duration
cash flows, comparisons to public-market indices become, in the report's
words, "apples-to-oranges."
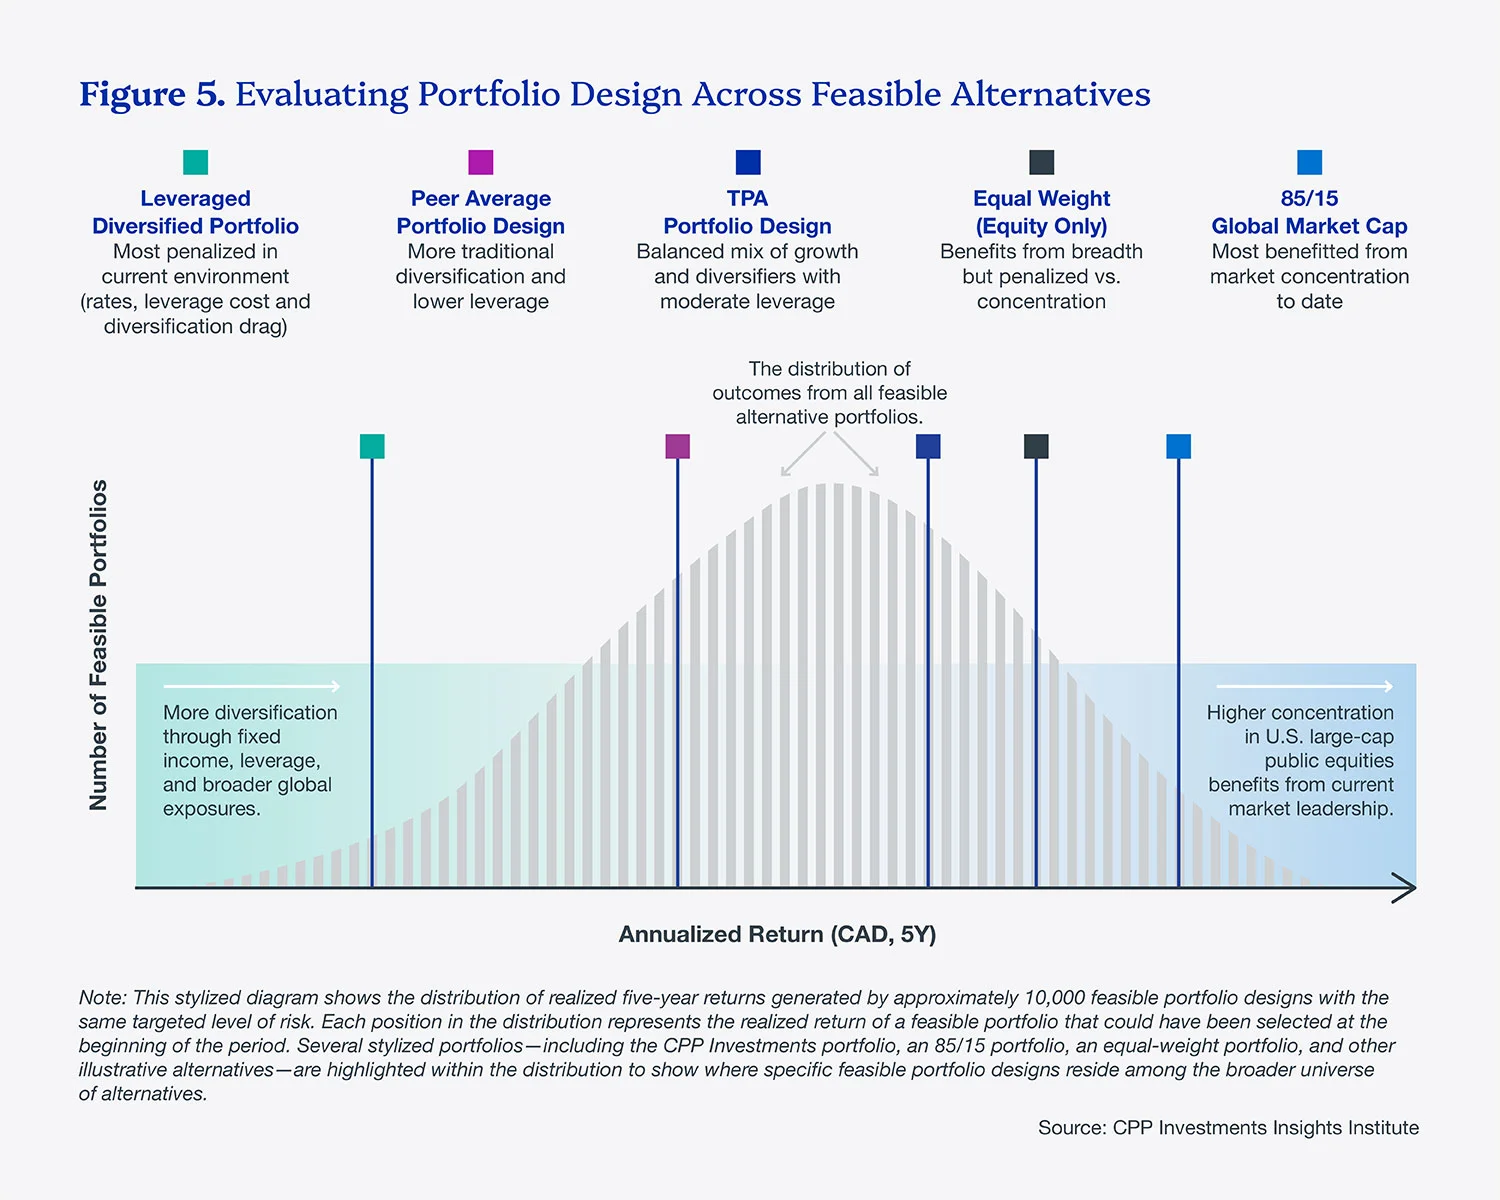
Over the past few years, the upper deciles of feasible portfolio returns have been dominated by heavy exposure to US tech mega-cap listed equities, according to the paper, leaving diversified designs in the lower portions of the distribution.
That
does not mean diversification failed, the authors argued, but rather
that portfolios built for many environments will lag concentrated,
equity-heavy portfolios in a market that rewards listed equities far
beyond expectations.
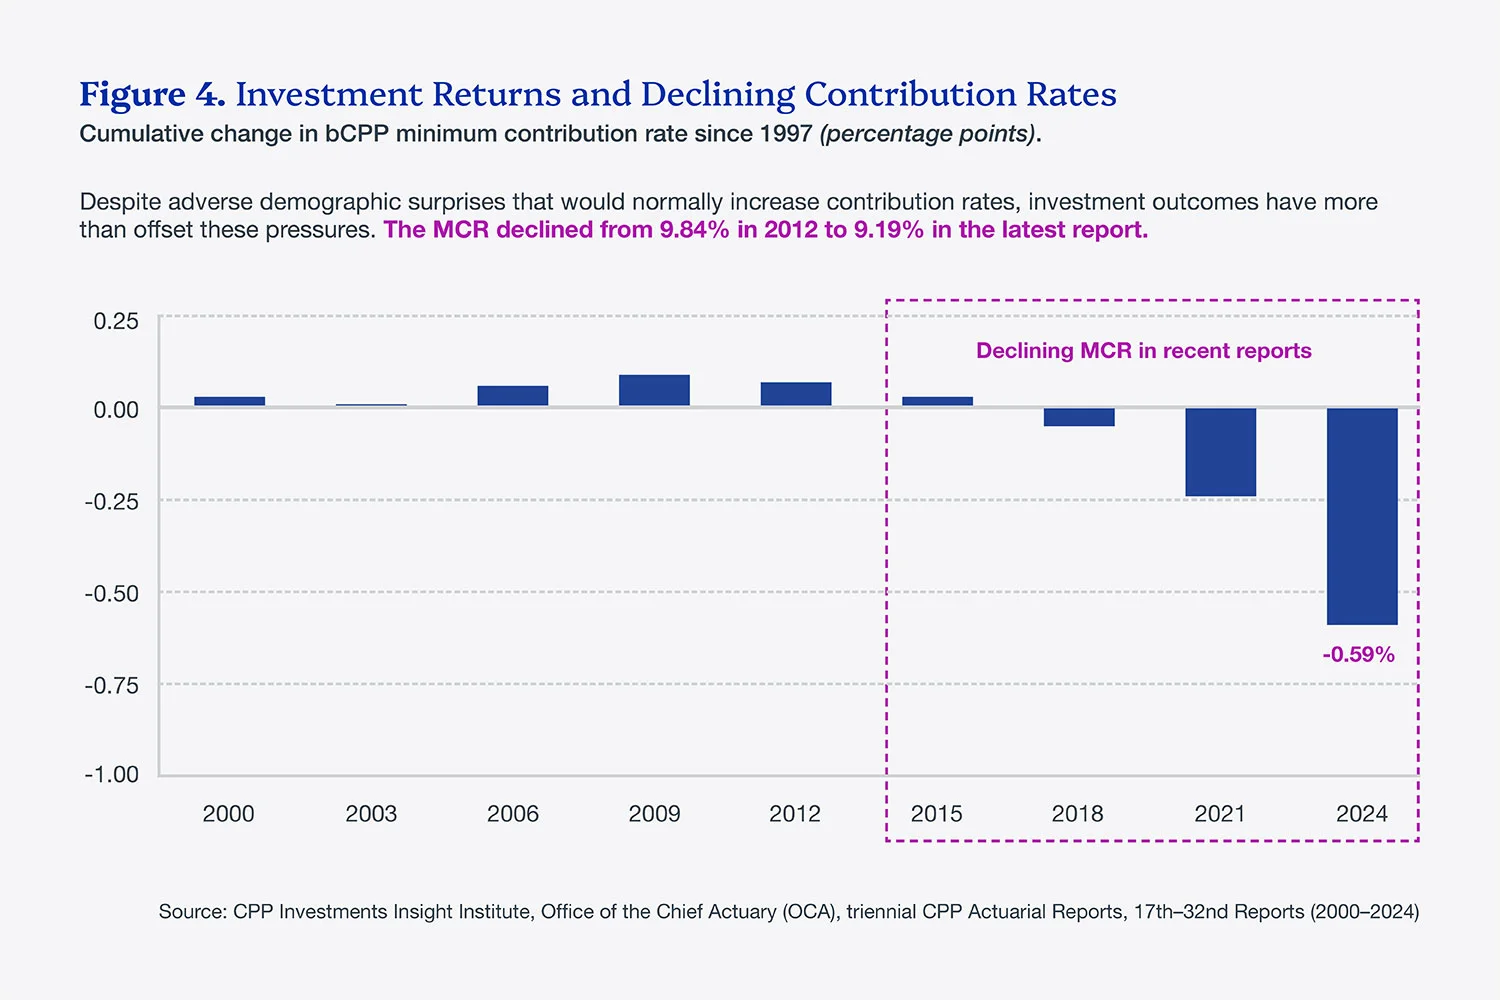
For plan sponsors weighing whether a differentiated strategy is paying off, the report offered CPP's own sustainability record as evidence on its risk-setting decision.
Investment
performance is estimated to have cut the base CPP minimum contribution
rate from 9.54 percent in the 31st actuarial report to roughly 9.19
percent, a fourth consecutive triennial decline.
Measured
from 2012, the rate has fallen from 9.84 percent despite adverse
demographic surprises that would normally push it higher.
The
Spring Economic Update 2026 proposed reducing the legislated base
statutory contribution rate from 9.9 percent to 9.5 percent starting in
2027, the report noted, citing the improved funding position.
CPP Investments targets a level of market risk equal to a portfolio of 85 percent global equities and 15 percent Canadian government bonds for the base plan, and 55 percent equities to 45 percent bonds for the additional plan.
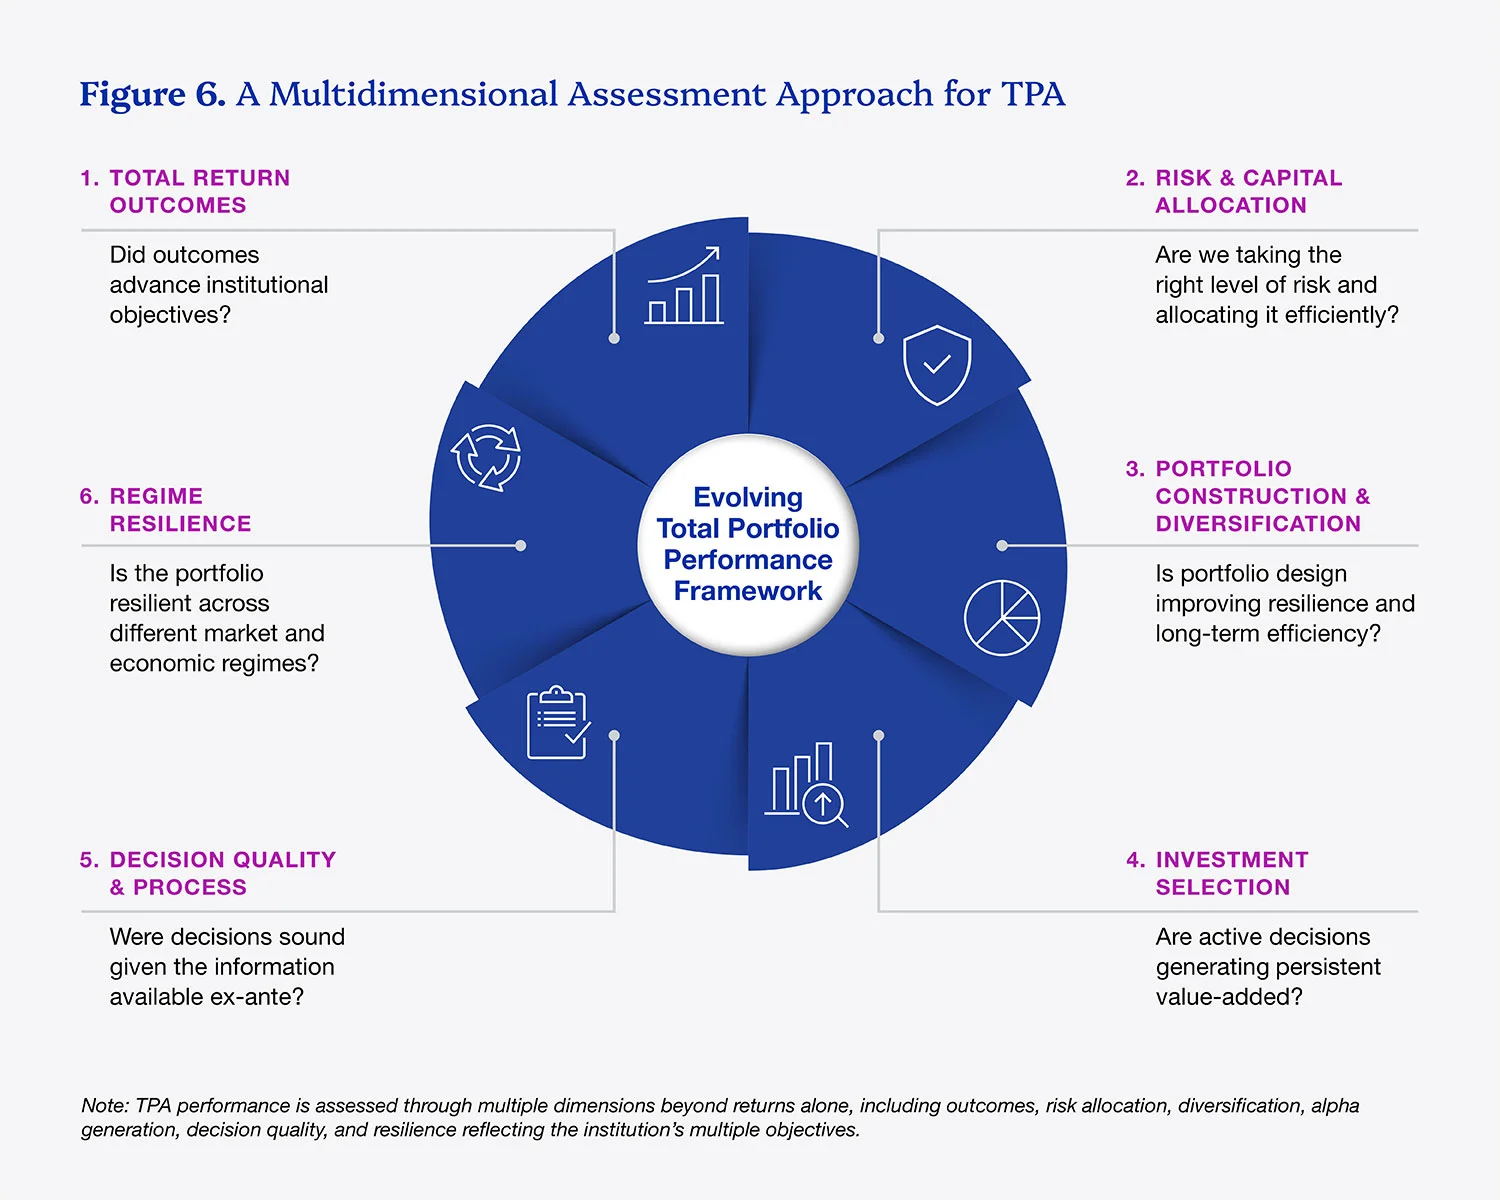
Rather
than replace benchmarks, the report positioned them as a diagnostic
input within a six-part framework spanning total return outcomes, risk
and capital allocation, portfolio construction and diversification,
investment selection, decision quality and process, and resilience
across market regimes.
Benchmark
outperformance does not always deliver institutional aims, the authors
wrote, since a strategy can beat its index simply by adding concentration or exposures already held elsewhere.
The
challenge reaches beyond pension investing, CPP Investments said, as
more organizations manage portfolios against multiple long-horizon goals
such as inflation protection and sustainability.
For
boards, the paper's takeaways were to align evaluation with delegated
decision rights, connect outcomes to objectives, and treat benchmarks as
one part of an overall assessment.
The
question, the authors concluded, is no longer whether a portfolio beat
its benchmark but whether every management decision improved the
delivery of long-term goals.
The paper was
written by Sally Shen, manager at the Insights Institute; Derek Walker,
managing director of total fund transformation initiatives; and
Geoffrey Rubin, senior managing director and one fund strategist.
Sally Shen, Derek Walker, and Geoffrey Rubin of CPP Investments wrote a second report entitled Measuring What Matters: Evaluating the Total Portfolio Approach:
For
decades, institutional investors operated in a relatively stable world.
Inflation was subdued, globalization deepened, and public markets
expanded. In this environment, traditional Strategic Asset Allocation
(SAA) frameworks offered a practical way to organize and measure
investment decisions: establish a “policy portfolio”, measure total-fund
returns against it, and assess active managers relative to their
benchmarks.
That world is changing.
Economic fragmentation, heightened geopolitical uncertainty and a
growing need for resilience across a wider range of market conditions
have led many investors to adopt variants of the Total Portfolio
Approach (TPA). As we explored in a previous report, TPA offers greater
flexibility to construct portfolios around long-term objectives by
managing risk, diversification, liquidity, and capital allocation at the
total-fund level rather than within asset-class silos.
Yet increasingly, the way portfolios are managed under TPA no longer
aligns neatly with how performance has traditionally been measured.
Under TPA, management becomes accountable for a much broader set of
interconnected decisions: how much risk to take, how to diversify
exposures, how to balance liquidity and illiquidity, and how to
implement those choices efficiently over time.
This leaves a fundamental question: how should realized performance
be evaluated when the portfolio itself is increasingly dynamic,
differentiated, and intentionally designed around multiple objectives?
This question is especially important for pension funds that are
accountable for delivering outcomes over decades—for CPP Investments,
over a 75-year actuarial horizon—while providing full transparency and
appropriate scrutiny.
Benchmark comparisons remain essential to evaluating active
management decisions and maintaining accountability. But under TPA they
are no longer sufficient on their own. Measuring the health of a total
portfolio requires a broader, multi-faceted framework capable of
assessing not only returns, but also the total portfolio’s resilience to
adverse market and economic circumstances, the impacts of
diversification, concentration and tactical decisions, the effectiveness
of implementation, and alignment with long-term objectives. This report
examines how CPP Investments is developing its approach.
The Limits of Benchmarks in TPA Performance Assessment
For all the enthusiasm around TPA, its credibility ultimately rests on a simple question: has it worked? Indeed, if institutions cannot assess whether an approach has worked in the past, it is difficult to maintain conviction that it will work in the future.
Traditional SAA frameworks split the overall investment decision into
two parts. First, the portfolio owner or board—often with the
assistance of a third-party consultant—chooses a policy portfolio of
asset classes and weights, with the returns forming the benchmark.
Management is then tasked with outperforming that benchmark. This
approach provides a straightforward view of management performance:
value added relative to a low-cost, investable benchmark.
However, one of the most important decisions—the choice of the policy
portfolio itself—typically escapes ongoing evaluation. This decision is
stored in the figurative “attic” while performance assessment is
focused solely on management’s deviations from the policy and active
management benchmark portfolios, rather than the policy portfolio’s
suitability for achieving the institution’s objectives (Figure 1).
TPA changes this accountability structure. Management becomes
accountable not only for active decisions relative to a benchmark, but
for the entire portfolio—from risk choices through targeting of total
portfolio exposures, to implementation. All portfolio decisions fall
within the scope of performance assessment and must be evaluated based
on how well they advanced institutional objectives. This broader
accountability requires tools that extend beyond the single benchmark
framework typically employed by SAA.
There are good reasons why benchmarks are deeply embedded in
institutional investing. First, they constitute simple, unambiguous
instructions from principal to agent. Coupled with an active risk limit
and a capital allocation, the managing agent understands that their task
is to beat the benchmark. And this same benchmark can be used for ex
post performance evaluation and incentive compensation, unifying both
measurement and management in a single, simple device.
Unfortunately, these features are insufficient for effective performance information and management under TPA.
Issue 1: Noisy Signals
Even genuinely value-additive investment strategies can
underperform a benchmark due to randomness—sometimes for extended
periods. While this challenge exists under traditional SAA frameworks,
it is more pronounced under TPA, where portfolios may intentionally
differ from conventional benchmarks in pursuit of diversification,
resilience or dynamic positioning.
Barras, Scaillet, and Wermers (2010) show that benchmark-relative
outperformance and underperformance often reflect luck over shorter
horizons. Barras, Beath, and Betermier (2026) further highlight how
noise accumulates along the total portfolio value chain, increasing the
likelihood that value-adding diversification decisions appear
unsuccessful over finite horizons.
Figure 2 illustrates this challenge. Because TPA portfolios
intentionally depart from conventional benchmarks, short-term
benchmark-relative underperformance remains plausible even when
portfolio decisions are sound and expected long-term outperformance is
intact. In short, performance relative to a benchmark provides important
evidence, but rarely a complete assessment of whether the total
portfolio is succeeding.
This figure provides a stylized illustration of benchmark
underperformance across evaluation horizons. The ellipses represent the
one-standard-deviation confidence region of 5-year outcomes for the
“SAA” and “TPA” portfolios with the same total risk target. The dot
within the ellipse represents the expected outcome.
The “SAA” portfolio in the left-hand panel is assumed to have a
value-added expectation of 90 bps (the vertical distance or “alpha” to
the diagonal line), delivered with relatively narrow error bands due to
its lower tracking error versus the benchmark. The “TPA” portfolio in
the right-hand panel is assumed to have a value-added expectation of 100
bps, but larger error bands due to substantially lower correlation of
its returns with the benchmark, arising from differentiated portfolio
construction and diversification decisions. The shaded area below the
diagonal line represents benchmark underperformance despite positive
true alpha (“false negatives”).
Over a single year, both the “SAA” and “TPA” portfolios show
significant incidence of underperformance to the benchmark (see the
table below Figure 2). At five- and 10-year horizons, the compression of
the “SAA” error bands makes false negatives increasingly unlikely. By
contrast, while the “TPA” error bands also compress over time, realized
benchmark underperformance remains plausible even at longer horizons
despite higher alpha expectations, as false-negative probabilities
remain elevated. Importantly, Figure 2 is not intended to suggest that
either the SAA portfolio or the TPA portfolio is inherently superior.
Rather, it illustrates a measurement challenge that arises when
portfolios are intentionally diversified away from a single benchmark.
Issue 2: Benchmarks That Do Not Reflect Intended Portfolio Design
A second challenge is that benchmarks can evolve significantly
over time. As market concentrations shift, capitalization-weighted
indices can come to embody risk exposures that differ materially from
those that portfolio managers intentionally seek to maintain. This
matters because TPA practitioners typically aim to diversify away from
concentrations that accumulate in widely used benchmarks.
Sorensen, Alonso, and Belanger (2023) describe this as the
benchmark’s “chameleon” nature: as market concentration rises,
diversification falls, and tight tracking-error constraints can force
managers to hold portfolios that are more concentrated than intended or
prudent.
This creates a distorted incentive problem. Benchmark-relative
evaluation can reward concentration when concentration is winning and
penalize diversification that is being maintained to support long-term
resilience. Over time, this can pull portfolios closer to the
benchmark—even when doing so undermines the broader objective of
diversification and total portfolio resilience.
Issue 3: Apples-to-Oranges Comparisons
As portfolios become more differentiated, comparisons to any
single benchmark become less informative. At CPP Investments, portfolio
outcomes reflect exposures to illiquidity premia, long-duration cash
flows, operational value creation, and other risk factors that are not
fully captured by public market benchmarks. The result: simple public
benchmark-relative performance is an apples-to-oranges comparison that
can mislead as much as it informs.
This limitation is particularly evident in private assets such as
infrastructure, where public benchmarks often fail to capture
contractual cash flows, inflation linkage, and long-term active
management of the portfolio assets. As Shen and Blanc-Brude (2022)
demonstrate, these characteristics are difficult to replicate through
conventional public-market benchmarks. As a result, private assets must
ultimately earn their place in the portfolio relative to public-market
alternatives. However, simple benchmark comparisons may not fully
capture their contribution.
These benchmarking issues, and expanded accountability for the entire
investment problem, make assessment of TPA performance difficult but
not impossible. Ex post performance assessment remains vital to
sustaining confidence and improving decisions over time.
The challenge, then, is assessing performance through multiple lenses rather than via a single verdict.
Moving Beyond Benchmarks
Ex post performance assessment under TPA begins with a clear
statement of institutional objectives. For some organizations, the
primary objective is pension plan sustainability (e.g., funded status or
contribution rate stability); for others, objectives may include
liquidity preservation, inflation protection, intergenerational
risk-sharing, or climate and other broad policy considerations. A
credible ex post assessment must evaluate success against each of those
ex ante objectives while also considering whether the decisions that
produced the outcomes were sound given the information and alternatives
available at the time.
CPP Investments’ objectives are grounded in the Canada Pension Plan Investment Board Act1:
To invest CPP assets with a view to achieving a maximum rate of
return, without undue risk of loss, having regard to the factors that
may affect the funding of the Canada Pension Plan;
To manage the fund in the best interests of CPP contributors and beneficiaries;
To assist the CPP in meeting its obligations to contributors and beneficiaries.
While these objectives are clear, they are multi-purpose and
multi-horizon. They must be translated into a more complete set of aims
that define risk appetite, outcome horizons, and the desired level of
portfolio resilience through market and economic cycles. Clarifying and
balancing those aims, and the constraints within which they must be
pursued, is a prerequisite for assessing TPA performance.
TPA performance is best understood by examining the many decisions
that collectively produce total portfolio outcomes. Decomposing
performance into its component decisions does not diminish management’s
accountability for overall results, but it does provide useful evidence
on the performance of each major link in the chain. Traditional
benchmark-based frameworks assess only parts of the investment
problem—typically the active components relative to benchmarks—while
disregarding the rest.
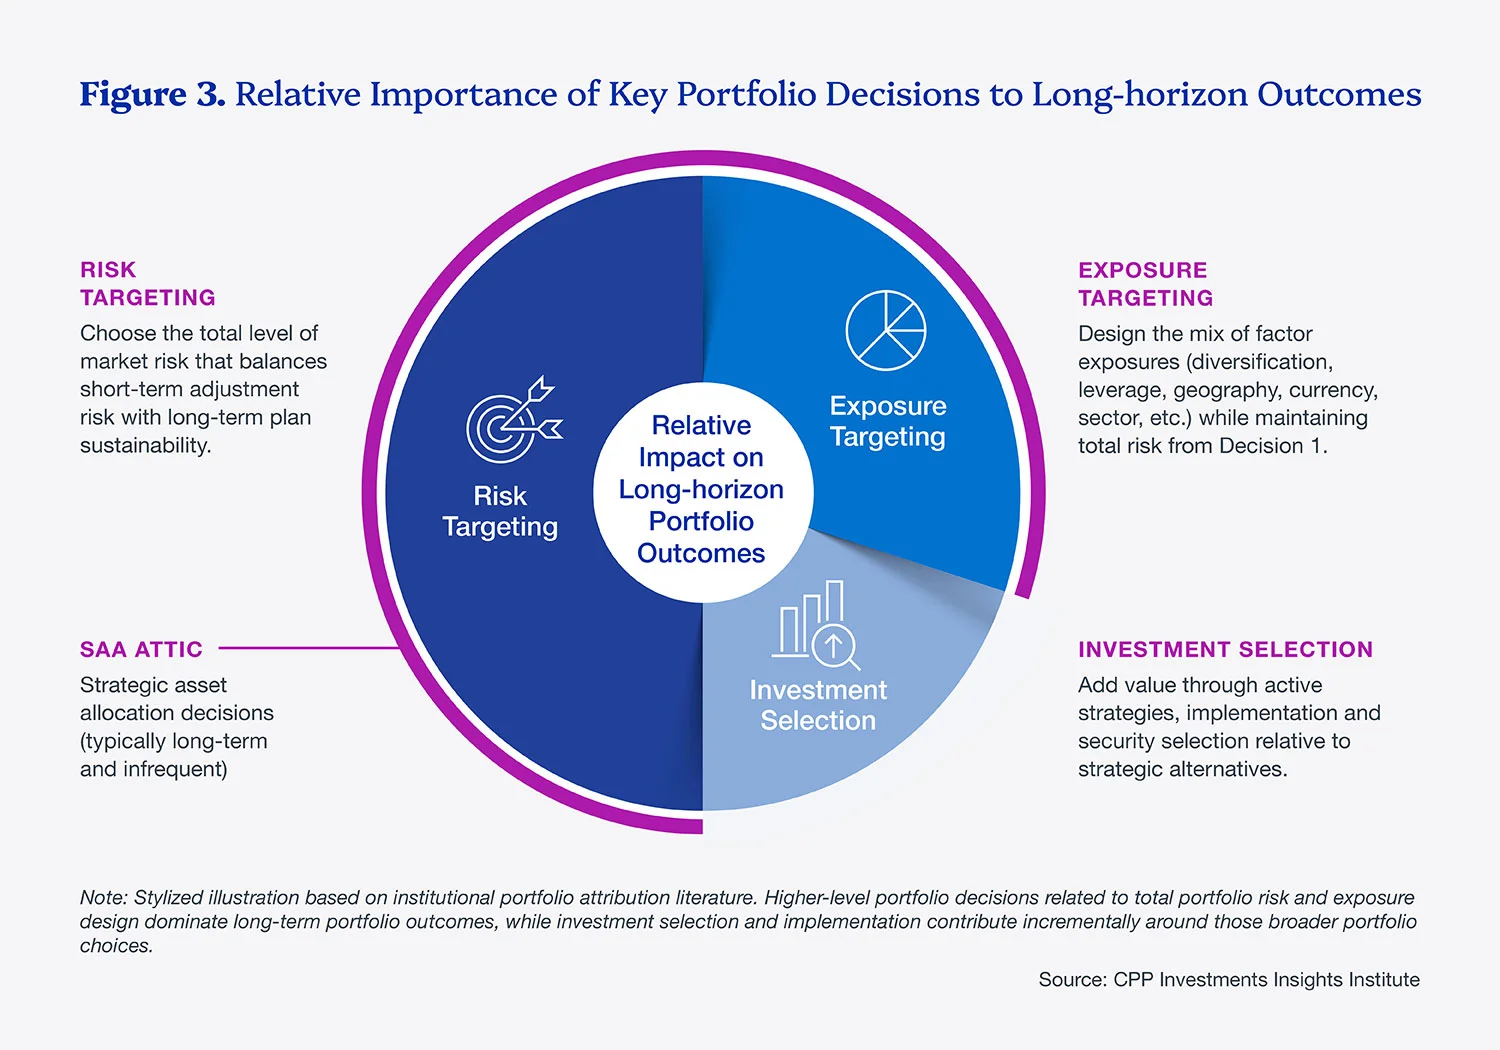
In practice, CPP Investments undertakes many investment decisions in
pursuit of its objectives. For the purposes of this report, we are
focusing on three that have an outsized influence on long-term
outcomes—risk level, exposure targeting, and investment selection.
Together, these decisions shape portfolio design, realized returns, and
delivery against objectives, though in different proportions (Figure 3).2
Here, we discuss each of these decisions and the approach to
understanding their performance, noting that this approach can be
extended to a wider range of decisions and institutional aims.
Decision 1: Risk Targeting: Did the chosen level of market risk optimize plan adjustment risk?
The first major TPA decision at CPP Investments is the level of
market risk the Fund should target. CPP Investments establishes a level
of market risk that optimizes the combination of positive and adverse
adjustments to the CPP that might arise from our realized investment
performance.
Lower-risk portfolios reduce short-term investment return volatility
but may deliver insufficient long-term returns to support CPP
sustainability. Higher-risk portfolios increase expected returns but
also increase the likelihood of adverse outcomes in the short-term. Risk
targeting therefore reflects a trade-off between short-term volatility
and long-term plan sustainability.
CPP Investments manages this trade-off by targeting a level of market
risk that best balances positive and adverse potential plan adjustments
over time. In this model, adverse outcomes carry more weight than
positive outcomes and nearer term outcomes carry more weight than
distant ones. For the base CPP, this work establishes a target level of
market risk equal to that of a portfolio comprised of 85% global
equities and 15% Canadian government bonds; and for the additional CPP
an equity-debt risk equivalence of 55% global equities and 45% Canadian
government bonds.3These levels of market risk generate
expected returns that exceed the minimum level required for CPP
sustainability, reducing the likelihood of adverse plan adjustments and
improving the likelihood of positive adjustments over time.
Has this decision worked? Figure 4 illustrates how these returns have
impacted base CPP sustainability and contributed to sustained
reductions in the Minimum Contribution Rate (MCR).4Most
recently, investment performance is estimated to have reduced the MCR
from 9.54% in the 31st OCA Actuarial Report (2021) to approximately
9.19%,5 marking the fourth consecutive triennial decline. The
Spring Economic Update 2026 proposed reducing the legislated base CPP
Statutory Contribution Rate from 9.9% to 9.5%, beginning in 2027,
reflecting the improved sustainability position of the CPP following the
latest triennial review.6
Decision 2: Exposure Targeting: Did portfolio design improve the investment outcome?
Portfolio design is the second major TPA decision at CPP
Investments. It includes choices related to diversification, leverage,
geography, currency, sector, and other systematic risks, while
maintaining the total risk established through risk targeting. There are
many ways to design a portfolio at the same overall risk level; CPP
Investments’ objective is to identify the portfolio most likely to
deliver objectives across a wide range of future states, rather than
maximize performance for any single objective or in any single market
environment.
Under TPA, there is no natural “default” portfolio. A benchmark,
whether a simple blend of 85% global large- and mid-cap equities and 15%
Canadian government bonds, an equal-weight index, or something more
customized, is only one feasible design among many. Portfolio design
should therefore be evaluated against a broad collection of feasible
alternatives that achieve the same risk target through different
portfolio construction approaches, resulting in materially different
exposures and trade-offs, not a single comparator.
In a sense, SAA is like a prize fight pitting the chosen portfolio
design against a single competitor, the benchmark. Management can study
this lone competitor at length, hugging or replicating the benchmark
where they possess no edge and separating and fighting where they sense
advantage. In this contest, the delivery of institutional aims is
subordinated to a singular focus on benchmark outperformance. TPA places
the chosen portfolio design in combat with all comers, aiming
to outperform all feasible alternatives in the service of institutional
aims. A more challenging prospect, for sure, but all possibilities are
equally relevant, and realized performance should be assessed against
each of these foregone alternatives.
Figure 5 illustrates CPP Investments’ approach to understanding the
performance of portfolio design. At the outset of any measurement
period, we identify a vast range of portfolios that share the targeted
level of market risk and conform to institutional constraints. These
alternatives differ by factor exposure, public and private composition,
diversification, leverage, liquidity, currency, geography and sector.
Each represents a viable design choice and will have delivered a
distinct realized return over the period. We consider many thousands of
foregone portfolio alternatives and calculate the realized returns of
each over the observation period, arraying these returns in the
distribution shown in Figure 5. The realized returns of our actual
chosen portfolio design are also included.
While TPA aims to find the single best portfolio from among the
multitude, there will always be some portfolios that outperform our
choice in any fixed observation period. In fact, the “winning” portfolio
design in any short time frame is typically suited only for the
environment that transpired, rather than the range of possible
environments that might unfold over time. The best long-horizon
portfolio design is one that maintains a position in the upper quintiles
of this distribution through many market cycles and under different
market conditions.
Over the past few years, the upper deciles of this realized return
distribution are dominated by portfolios with heavy exposure to U.S.
tech mega-cap listed equities. Given the extreme dominance of U.S.
public equities’ returns, particularly in a few industries, diversified
portfolio designs delivered returns in the lower portions of the
distribution, with private-asset heavy portfolios tending to be further
to the left. This does not necessarily imply that diversification
failed. Rather, it demonstrates that portfolios designed for many
environments will underperform concentrated equity-centric portfolios in
environments that deliver listed equity returns far in excess of
expectations.
This technique rigorously assesses the portfolio design choice
without reverting to comparisons with a single benchmark. The
positioning of realized returns within the distribution of all viable
alternatives provides critical evidence on the success of the TPA
exposure targeting choice in supporting institutional aims.
Decision 3: Investment Selection: Separating Skill-Based Value Added from Market-Driven Returns
Investment selection is the third TPA decision evaluated at CPP
Investments. It relies more heavily on benchmark comparisons. CPP
Investments compares the realized investment performance of each
investment strategy to a benchmark comprised of public market indices
with similar systematic risk exposures. Results are then aggregated to
the department level, helping distinguish skill-based value added from
the beta-driven returns generated by broader portfolio design decisions.
The aggregation of these benchmarks provides an overall “Benchmark
Portfolio” for the base and alternative CPP, providing a view of the
collective impact of investment decisions. While management remains
accountable for total portfolio outcomes; these benchmark comparisons
help assess the contributions of individual strategies and departments.
For private assets, it is critical to distinguish between two separate
sources of value added: the strategic decision to invest through private
rather than public markets, and the investment skill demonstrated
relative to an appropriate private-market benchmark.7
Toward a Multidimensional Assessment of TPA Performance
Under a traditional SAA framework, the benchmark often acts as
the objective, the instruction set, and the scorecard. Under TPA,
management is accountable for a broader set of decisions that require
multiple lenses. Performance assessment must go beyond absolute and
relative returns and consider risk-setting, diversification, resilience,
risk and capital allocation, portfolio construction, implementation
skill and decision quality (Figure 6). An assessment must also consider
whether governance processes are functioning effectively and whether the
portfolio remains aligned with long-term objectives.
CPP Investments assembles the pieces of performance assessment that
provide a more complete picture of whether and how TPA is improving
long-term outcomes. Different metrics answer different questions.
Reference portfolio comparisons help assess broad design choices, global
market portfolios provide context on opportunity cost, unlevered
portfolios isolate the impact of leverage, and peer comparisons offer an
external perspective.
Benchmark outperformance is an important part of this balanced view.
At the investment strategy level, benchmarks help distinguish alpha from
beta returns and assess implementation skill, and at the total
portfolio level they help explain aggregate implementation outcomes.
Under TPA, benchmarks are a diagnostic input into performance evaluation
rather than the sole measure of success. This distinction matters
because benchmark outperformance does not always deliver institutional
aims. A single strategy can outperform its benchmark by increasing
concentration or adding exposures already held elsewhere in the
portfolio. Conversely, the total portfolio may intentionally accept
benchmark-relative headwinds if doing so improves diversification,
resilience or alignment with long-term goals.
Conclusion
Performance assessment is difficult under a Total Portfolio
Approach—not because performance is less measurable, but because the
scope of accountability is broader.
A credible ex post assessment framework should be linked to
institutional aims and employ multiple lenses, including risk targeting,
diversification, portfolio construction, investment selection and
long-term sustainability outcomes. Benchmarks remain essential tools
for attribution, discipline and accountability, but under TPA they
become diagnostic inputs rather than singular verdicts on success or
failure.
This challenge extends beyond pension investing. As organizations
increasingly manage portfolios against multiple long-horizon
objectives—including environmental sustainability, development,
inflation protection, or social objectives—performance assessment cannot
be meaningfully reduced to a single benchmark-relative outcome.
For boards and portfolio owners, the key takeaways are to:
align evaluation with the delegated decision rights;
connect outcomes to objectives; and
use benchmarks as part of an overall assessment rather than as the sole measure of success.
The question is no longer simply whether a portfolio outperformed a
benchmark, but whether all management decisions, including portfolio
design and execution, improved the delivery of long-term institutional
goals.
This is another excellent report on CPP Investments' total portfolio approach (TPA) that will surely stir conversations at the Maple 8 and beyond.
Make sure you read their first report, Investing in Uncertain Times: Achieving Disciplined Flexibility in the Total Portfolio Approach, which is available here. I covered it here.
Sally Shen, Derek Walker, and Geoffrey Rubin are very smart, no doubt about it, and they really do a great job distinguishing between the strategic asset allocation (SAA) framework and the total portfolio approach (TPA) and how the latter broadens diversification in a more meaningful way, and better aligns outcomes with objectives.
The big problem with TPA -- and they allude to this -- is that it's much harder to measure its success relative to the more straightforward benchmark comparison in SAA, which is used to evaluate active management decisions:
Benchmark comparisons remain essential to evaluating active
management decisions and maintaining accountability. But under TPA they
are no longer sufficient on their own.Measuring the health of a total
portfolio requires a broader, multi-faceted framework capable of
assessing not only returns, but also the total portfolio’s resilience to
adverse market and economic circumstances, the impacts of
diversification, concentration and tactical decisions, the effectiveness
of implementation, and alignment with long-term objectives. This report
examines how CPP Investments is developing its approach.
Now, let's stop to ponder this for a second.
Critics will claim this is all rubbish. If CPP Investments cannot beat a low-cost index portfolio over a one, three, or five-year period, then why are we paying their employees big bucks to actively manage our pension assets?
For them, these discussions on TPA are nothing more than a theoretical exercise in obfuscation: "Benchmarks don't work any longer because concentration risk in equities is too high; trust our TPA approach is much more sophisticated and resilient than the traditional SAA approach."
For critics, it's simple: if you can't beat a low-cost ETF over a 5-year period, then there is no point in actively managing pension assets, even if you're delivering decent returns above the actuarial target.
And to be sure, the State Street SPDR S&P 500 ETF Trust (SPY) is up 73% over the last 5 years, led by the VanEck Semiconductor ETF (SMH), which is up 373% over that period.
In other words, five years ago, we could have closed down CPP Investments and all the other Maple 8 funds and shoved all the pension assets into the SPY, generating eye-watering returns, and saving hundreds of millions in fees to external managers and hefty compensation to the employees of these large Canadian pension funds (especially their senior managers).
Even if you put 85% or 70% of the assets in SPY or MSCI ACWI and the rest in a Canadian, US or a global aggregate bond ETF, you'd come out way ahead in terms of returns.
This is all true, but it's missing an important consideration: the risk of having such a high allocation to US or global equities when the concentration risk remains at a very high level.
Still, critics will snap back: "So what, concentration risk is fine as long as the bubble keeps inflating, and nobody knows when it will pop. It could last years"
Here is where we need to pause and ask: "Will US equities over the next 5 years produce anything close to what they produced in the last 5 years?"
And I say US because US equities dominate global equity indexes.
My answer is that it's highly unlikely that US equities come anywhere close to producing the same return over the next 5 years, and I also fear bonds will severely underperform if stagflation develops.
So, if public equities will not provide the requisite return, and neither do bonds, pension funds are left with alternative assets like infrastructure, real estate, private equity and private debt.
This is where a total portfolio approach (TPA) differs from strategic asset allocation (SAA), as it directly links an outcome (attaining a return above the actuarial rate-of-return over the long run) to the objective of the pension fund, ie. maximizing returns without undue risk of loss, with regard to the funded status of the plan.
TPA also does a better job linking pension assets with their long-dated liabilities in a more comprehensive way.
CPP Investments is managing over $800 billion in assets, you definitely don't want them to be all in equities and they are large enough to take on illiquidity risk in assets that offer more stable, inflation-protected returns.
Moreover, the diversity of the portfolio, whether it's geographic, sector or by asset class and strategy, makes the Fund more resilient to downside risks over the long run.
That is the point CEO John Graham was driving at when he recently penned a comment on why protecting the CPP means taking the long view on investment returns.
If these highly-paid, smart folks at CPP Investments can't beat their own benchmarks, why are we paying them for?
In fact, the same argument can be expanded to all the Maple 8 funds since they all underperformed their benchmark over the last three years as concentration risk in US equities has risen to historic highs.
Part of the answer is you're paying them to deliver consistent returns over their actuarial target (for most it's around 6%) over the long run, and you absolutely want them to minimize their drawdown to avoid another 2008 fiasco, where most pension funds were down 20% to 40%.
Critics will still come at you: "Who cares if stocks decline 40%, they always bounce back big."
Well, not always. Sometimes stocks keep going down for years, and it can take decades to come back to a previous peak.
This is where the real value of adopting a total portfolio approach is critical for pension funds, because when the music stops and things start heading south, you want your pension fund to sustain that hit as best as possible (they will lose money but nowhere near as much as a pure equity fund).
Moreover, sophisticated pension funds like CPP Investments manage their liquidity well, so they will be able to pounce on opportunities when market dislocations occur.
"Ok, Leo, that's all fine and dandy, but how are we supposed to measure the success of TPA properly? It's not as straightforward as SAA."
Correct, it isn't easy, and nor am I suggesting it's easy to measure the success of TPA, but the easiest way is to link it to outcomes.
Are you getting the outcome you're desiring over the long run with a diverse TPA approach?
If so, then that is really all that matters.
Is TPA perfect? Hell no! There are still a lot of issues to contend and lots of uncertainty.
For example, what if there is a structural change in private equity? How does TPA account for this structural risk properly? The same applies to other illiquid asset classes and private debt.
How does TPA account for all risks? For example, CPP Investments is underweight tech shares in global stock markets but overweight data centres in illiquid asset classes.
Is that a disconnect or an appropriate risk to take?
And benchmarks remain important, but they are far from perfect and should be comprehensively reviewed every three or five years, and changed like BCI did last fiscal year? (to introduce more sector-neutral indexes or equal-weight indexes)
Any changes to benchmarks must be clearly stated in the annual report with a full discussion and analysis.
Equally important: What is the opportunity cost of adopting a TPA framework over an SAA framework?
In the last five years, it's been huge, but was this always the case?
CPP Investments and other large pension funds espousing a TPA approach need to provide numbers and hard facts to back up their case for TPA, not just conjecture and "trust us, we know best."
If not, the critics will always lurk in the background, claiming they are bloated pension funds that keep underperforming their benchmarks while they dole out huge compensation to senior managers.
This is an important discussion and I am only scratching the surface.
I'd need to interview Sally Shen, Derek Walker, and Geoffrey Rubin to really get into it properly with them but they have done a fantastic job highlighting the important issues and why TPA is a better framework than SAA for pension funds.
Below, CPP Investments' CEO John Graham joins Nicolai Tangen, CEO of Norges Bank Investment Management, for a great discussion in his In Good Company podcast.
Take the time to listen to this podcast, John goes over many important points on their total portfolio approach, and Nicolai does another masterful job of asking all the right questions.


Comments
Post a Comment