A Conversation With CPP Investments CEO on Their FY 2025 Results

The chief executive of CPP Investments says he has no plans to reduce the portfolio’s allocation to the United States despite volatility sparked by U.S. President Donald Trump’s protectionist policies and trade threats.
“The U.S. continued, through the fiscal year at least, to be … the highest performing region,” John Graham said in an interview after the fund posted a 9.3 per cent return for the fiscal year ended in March.
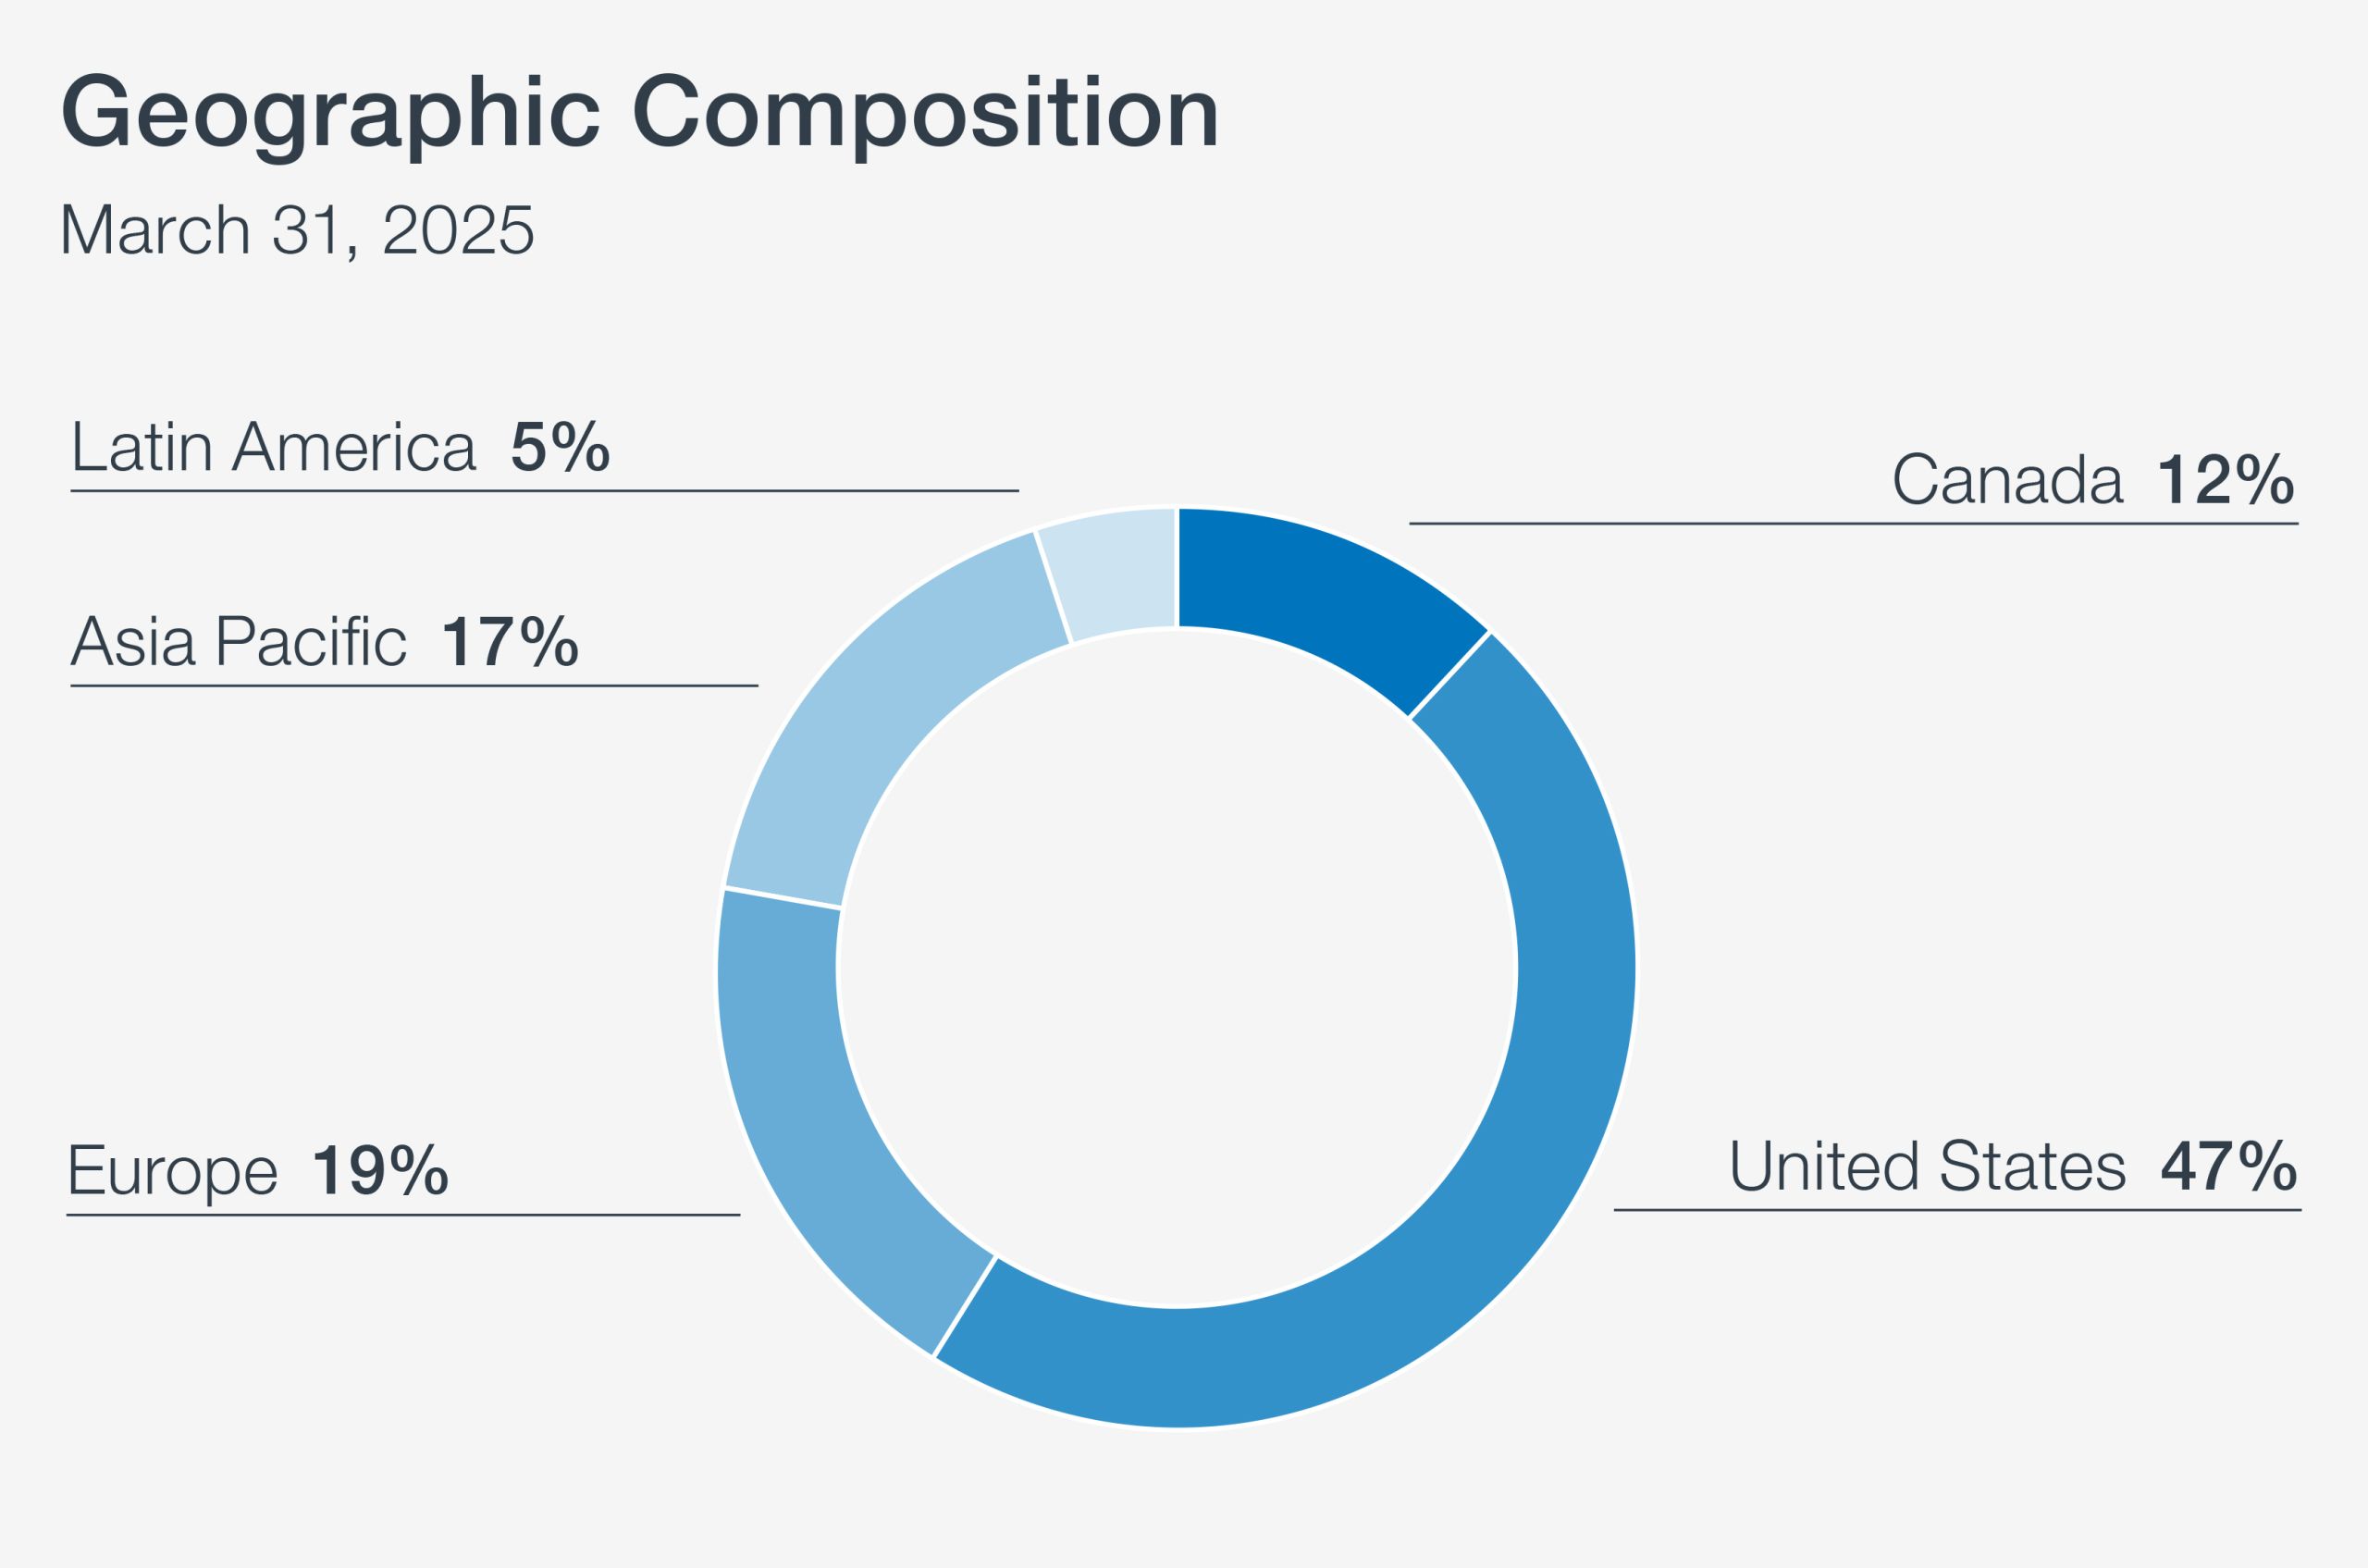
The CPP fund’s U.S. exposure grew to 47 per cent in fiscal 2025, up from 42 per cent a year earlier.
“A lot of that is just appreciation,” he said, noting that the U.S. dollar also rose against the Canadian currency for much of the year.
The CPP fund’s net assets now total $714.4 billion, up from $632.3 billion at fiscal 2024.
“One of the challenges we all have is, if you take your hands off the steering wheel … your U.S. allocation just grows. We actually have to actively manage to keep it into that kind of mid-40s range,” Graham said.
“We look at our allocation in every country, and we’re actually reasonably comfortable where we are today. It is a little bit of business as usual for us right now in kind of operating the portfolio.”
The pension organization aims to maintain the percentage of assets allocated to the U.S. in the mid-40s even though that is considered under-invested there by some observers because the U.S. represents about 70 per cent of global capital markets, Graham said.
The “business as usual” approach stems from the design of the CPP fund, including its size and diversification across geographic regions and asset classes, he said.
“With an organization such as CPP investments, where we have $714 billion (invested), we can’t be over-reactionary,” he said. “We build a long-term diversified portfolio. We can’t be exposed unduly to any one decision that someone makes around the world.”
Investing in equity markets has been a “wild ride” since January, he said, setting CPP Investments up for a more challenging fiscal year.
“I don’t think anybody really knows where we’re going from here,” he said, adding that uncertainty is stemming not only from ongoing trade threats but also what he described as more “idiosyncratic” behaviour from countries including the United States with a heavier focus on national interests.
Though no major changes are planned for asset allocation, there are likely to be ripple effects from the political trends across global markets, Graham said.
“With some of the uncertainty and the volatility that’s been created over the past few months, our expectation is that global growth is going to take a hit (and) that this is not going to be super good for global growth over the next few years,” he said.
“There is going to be no safe harbour. Every country will feel that that impact.”
Outside the U.S., Europe and Asia Pacific account for 19 per cent and 17 per cent of the CPP fund, respectively. Twelve per cent of the holdings are in Canada, and five per cent is invested in Latin America.
Graham said CPP has a total of $114 billion invested in Canada, and the net allocation remained stable over the past year on a growing asset base.
The previous federal Liberal government was pushing hard for large pension funds to boost the amount they invest in Canada and to increase disclosure about how they allocate their funds. But pension executives said there was a lack of large, scalable infrastructure available to invest in domestically.
That may be changing with the new government under Prime Minister Mark Carney and other policymakers galvanized by recent trade-related interventions to re-think Canadian industrial policy, aiming to make the country stronger and more independent, Graham said.
In his election platform, Carney said he’s planning to use government funds to “catalyze” increased private investment in sectors including housing, defence production, trade and transportation infrastructure, digital innovation and patents, critical minerals and energy.
“We’re quite encouraged and we’re quite hopeful that we’re going to see some interesting investment opportunities … that really fit our scale, our time horizon, our patient capital,” Graham said, adding that he has investing teams focussed on infrastructure investments around the world.
“We’re really keen on energy, we’re really keen on pipelines, we’re really keen on conventional energy, oil and gas, renewables,” he said.
Early discussions have been encouraging and, in return, Graham said his team has been sending a message: “CPP Investments is open for business.”
“(One) of the things that (is) encouraging is people are talking about specifics (about) what type of infrastructure needs to be built,” he said adding that additional details will be important.
“We need to partner with people, and we can invest in these projects, but we don’t operate these projects,” he said.
Graham did not rule out interest in the Trans Mountain pipeline, which the government is expected to put on the block at some point.
“I don’t know any of the details of Trans Mountain, but, as I said, we would look at any any asset…. The team will be happy to look at (it).”
Another area of interest is digital infrastructure.
“We think there is an opportunity for large-scale digital infrastructure projects and across the country, and actually have a view that Canada is ideally situated for this, but it has to be done right” he said. “We already have investments domestically in digital infrastructure. We have some credit investments (and we’re) looking at equity investments…. We’re pretty keen and bullish on what AI can do.”
The CPP fund posted a 10-year return of 8.3 per cent, with cumulative net income of $492.1 billion since inception in 1999.
The increase to net assets in fiscal 2025, which ended March 31, consisted of $59.8 billion in net income and $22.3 billion in net transfers from the Canada Pension Plan (CPP).
Today, CPP Investments issued a press release stating its net assets totalled $714.4 billion at 2025 fiscal year end:
Highlights1:
- Net income of $59.8 billion, one of the highest levels in our history
- Net annual return of 9.3% in fiscal 2025
- Net annual return of 14.2% in calendar 2024
- 10-year net return of 8.3%
- Cumulative net income of $492.1 billion since inception in 1999
TORONTO, ON (May 21, 2025): Canada Pension Plan Investment Board (CPP Investments) ended its fiscal year on March 31, 2025, with net assets of $714.4 billion, compared to $632.3 billion at the end of fiscal 2024. The $82.1 billion increase in net assets consisted of $59.8 billion in net income and $22.3 billion in net transfers from the Canada Pension Plan (CPP).The Fund, which consists of the base CPP and additional CPP accounts, generated a net return of 9.3% for the fiscal year. Since the CPP is designed to serve multiple generations of beneficiaries, evaluating the performance of CPP Investments over extended periods is more suitable than in single years. The Fund returned a 10-year annualized net return of 8.3%. Since CPP Investments first started investing the Fund in 1999, it has contributed $492.1 billion in cumulative net income, which is approximately 70% of its value today, with the balance attributed to net contributions.
“The Fund’s performance during the fiscal year was strong, with all investment departments contributing to one of the highest levels of annual net income in our history — despite market headwinds in the final quarter,” said John Graham, President & CEO. “The Fund remains on solid financial footing and is well-positioned to deliver long-term value for current and future generations of Canadians.”
On a calendar-year basis, the Fund delivered a 14.2% net return, reflecting strong global equity market growth during that period, compared to a lower return environment in the last quarter of the fiscal year.
The multi-strategy platform employed by CPP Investments continues to deliver value. Strong returns across multiple assets classes were instrumental in driving the Fund’s fiscal year results. Public equities, especially in the U.S. and China, delivered gains despite geopolitical and trade-related headwinds in the fourth quarter. Investments in private equities and infrastructure contributed positively to returns, as did credit, which benefited from tightening credit spreads. The strengthening of other currencies against the Canadian dollar was a significant contributor to gains across our asset classes for the year.
“Our portfolio – diversified across sectors, themes, asset types and geographic markets – is built for the long term. And while we’re not immune to short-term market shifts, our strategy is designed to remain resilient despite periodic fluctuations,” added Graham. “Our investment strategy continues to deliver, earning $492.1 billion in cumulative net income since we started investing the Fund more than 25 years ago. By investing today in high-quality opportunities – from technology to infrastructure – we’re positioning the Fund to deliver steady returns over the long term.”
“In times of uncertainty, Canadians can take comfort in knowing that the CPP is designed to support them in retirement,” added Graham. “At CPP Investments, our team is working diligently to help ensure the Fund remains financially strong for generations to come. In fact, in 2024, approximately six million Canadians received their CPP benefits.”
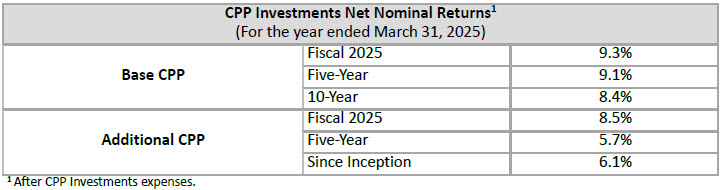
Performance of the Base and Additional CPP Accounts
The base CPP account ended the fiscal year on March 31, 2025, with net assets of $655.8 billion, compared to $593.8 billion at the end of fiscal 2024. The $62.0 billion increase in net assets consisted of $55.8 billion in net income and $6.2 billion in net transfers from the base CPP. The base CPP account’s net return for the fiscal year was 9.3% and the 10-year annualized net return was 8.4%.
The additional CPP account ended the fiscal year on March 31, 2025, with net assets of $58.6 billion, compared to $38.5 billion at the end of fiscal 2024. The $20.1 billion increase in net assets consisted of $4.0 billion in net income and $16.1 billion in net transfers from the additional CPP. The additional CPP account’s net return for the fiscal year was 8.5% and the annualized net return since inception was 6.1%.
The additional CPP was designed with a different legislative funding profile and contribution rate compared to the base CPP. Given the differences in its design, the additional CPP has had a different market risk target and investment profile since its inception in 2019. As a result of these differences, we expect the performance of the additional CPP to generally differ from that of the base CPP.
Furthermore, due to the differences in its net contribution profile, the additional CPP account’s assets are also expected to grow at a much faster rate than those in the base CPP account.
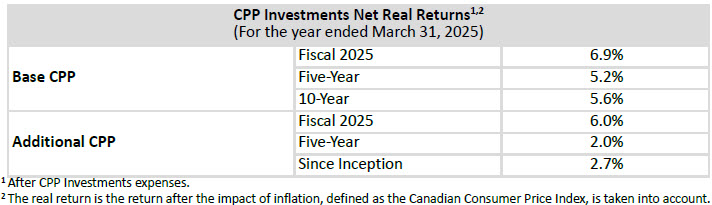
Long-Term Financial SustainabilityEvery three years, the Office of the Chief Actuary of Canada, an independent federal body that provides checks and balances on the future costs of the CPP, evaluates the financial sustainability of the CPP over a long period. In the most recent triennial review published in December 2022, the Chief Actuary reaffirmed that, as at December 31, 2021, both the base and additional CPP continue to be financially sustainable over the long term at the legislated contribution rates.
The Chief Actuary’s projections are based on the assumption that, over the 75 years following 2021, the base CPP account will earn an average annual rate of return of 3.69% above the rate of Canadian consumer price inflation. The corresponding assumption is that the additional CPP account will earn an average annual real rate of return of 3.27%.
Relative PerformanceThe CPP is designed to serve today’s contributors and beneficiaries while looking ahead to future decades and across multiple generations. CPP Investments was created to invest and help grow the Fund, maximizing returns without undue risk of loss.
In fiscal 2025, the benchmark portfolios replaced the market risk targets (previously known as the reference portfolios) as our benchmark against which relative performance is measured. The benchmark portfolios provide target allocations for our active and balancing investment strategies. We construct the benchmark portfolios by aggregating the public market index benchmarks that serve as passive, investible alternatives for each individual investment strategy.
Prior to the introduction of the benchmark portfolios, the market risk targets served as both our performance benchmark and a representation of our targeted level of market risk. Over time, however, the market risk targets became less aligned with the targeted exposures of our investment portfolios. During the first era of active management, the composition of the reference portfolio matched that of the base CPP investment portfolio. Over time, the development and growth of a multi-strategy platform made the reference portfolio significantly less diversified than a sophisticated global portfolio that is representative of CPP Investments’ statutory mandate, rendering it an inadequate measure of performance today. The benchmark portfolios better reflect our diversified investment approach and long-term strategy, offering performance benchmarking that is more relevant and accurate today as an alternative passive strategy to the investment portfolios compared to the earlier era.
CPP Investments’ performance relative to the benchmark portfolios is measured in percentage terms, after deducting all costs, known as value added.
On a relative basis, the Fund’s 10-year return outperformed the aggregated benchmark portfolios, generating 1.4% in value added. This amounts to billions of dollars that are attributable to active management (after costs). The benchmark portfolios’ fiscal 2025 return of 10.9% exceeded the Fund’s net return of 9.3% by 1.6%.
The benchmark portfolios’ outperformance in fiscal 2025 was primarily due to strong double-digit returns from levered global public equity indexes. While the Fund’s diversified asset mix helps reduce the impact of sharp equity market declines, it can also limit participation in equity market rallies, such as those reflected in the benchmark portfolios’ public market indexes.
For information on which of our decisions we believe are adding the most value, please refer to page 39 of the CPP Investments Fiscal 2025 Annual Report.
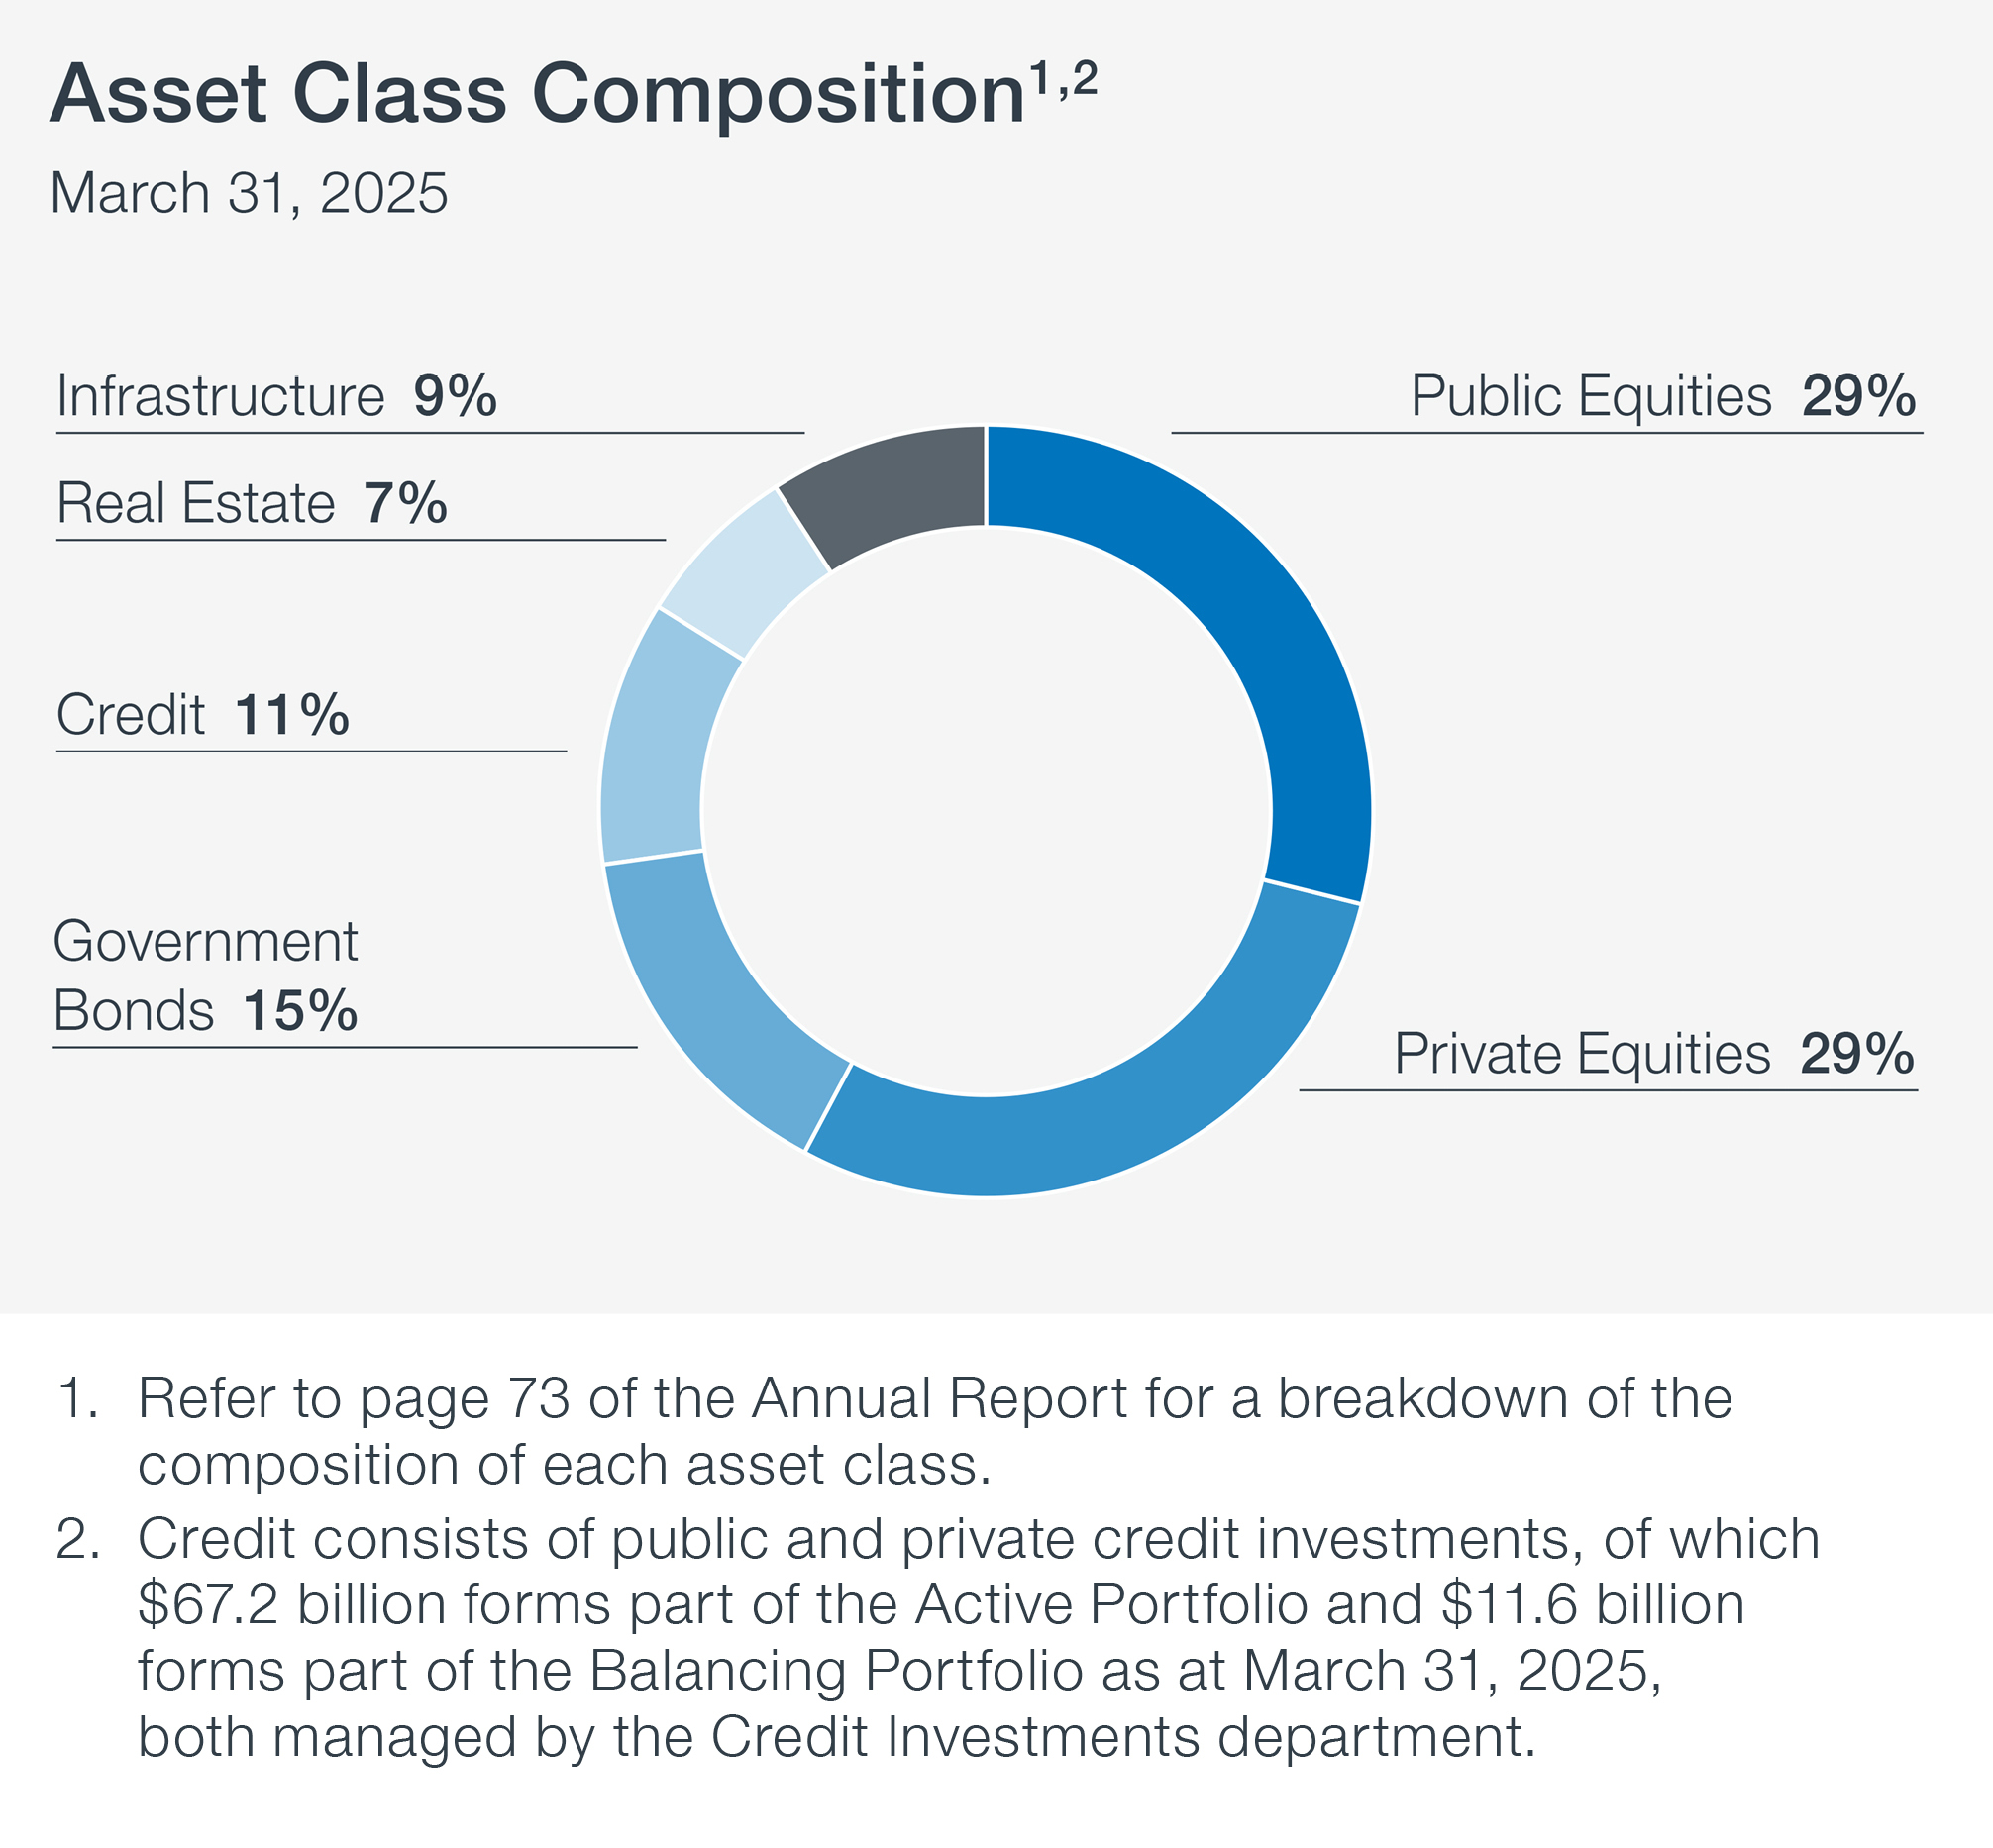
Asset Class and Geography Composition
CPP Investments, inclusive of both the base CPP and additional CPP investment portfolios, is diversified across asset classes and geographic markets.
Performance by Asset Class and Geographic Markets
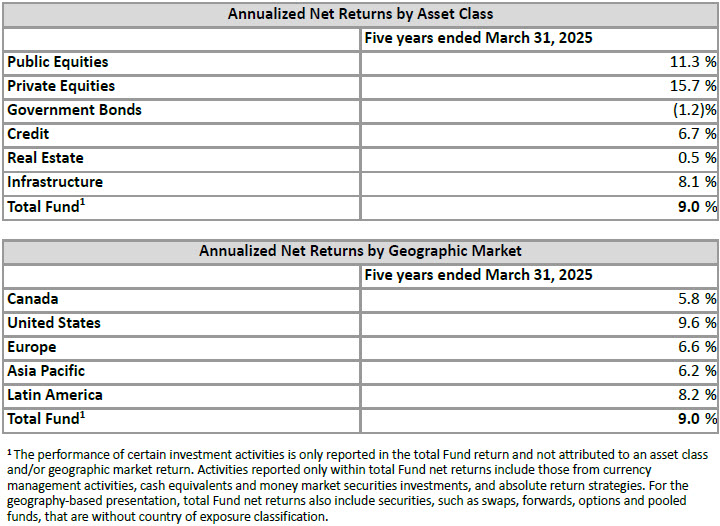
Five-year Fund returns by asset class and geographic markets are reported in the tables below. A more detailed breakdown of performance by investment department is included on page 50 of the Fiscal 2025 Annual Report.
Managing CPP Investments CostsDiscipline in cost management is a main thrust of our public accountability as we operate an internationally competitive enterprise that exists to create enduring value for multiple generations of beneficiaries of the CPP.
To generate $59.8 billion of net income, CPP Investments directly and indirectly incurred $1,756 million of operating expenses, $1,760 million in investment management fees and $2,223 million in performance fees paid to external managers, as well as $730 million of transaction-related costs.
Operating expenses increased by $139 million due to inflationary pressure impacting salaries and employee benefits, incentive compensation aligned with Fund performance, foreign exchange impact, and expenditures related to technology and software licenses. Our operating expense ratio continues to decline and is 26.1 basis points (bps), which is below the five-year average of 27.7 bps and below the 27.5 bps in fiscal 2024. Management fees increased by $311 million, driven by growth in externally managed assets. Performance fees increased by $156 million reflecting the positive performance delivered by our external managers.
Transaction-related costs, which increased by $303 million, vary from year to year according to the activity level, size and complexity of our investing activities. In fiscal 2025, we announced more than 100 transactions of C$100 million or more. Major infrastructure, sustainable energy, and private equity transactions in the U.S. and Europe drove the year-over-year increase. Other categories affecting our total cost profile include taxes and expenses associated with various forms of leverage.
Page 28 of the Fiscal 2025 Annual Report provides a discussion of how we manage our costs. For a complete overview of CPP Investments combined expenses, including year-over-year comparisons, refer to page 47.
Operational Highlights for the Year
Corporate developments
- Ranked one of the world’s top-performing public pension funds by Global SWF when measuring annualized returns between calendar years 2015 and 2024 (Global SWF Data Platform, May 2025).
- Ranked second among 75 pension funds across 15 countries in the 2024 Global Pension Transparency Benchmark developed by Top1000funds.com and CEM Benchmarking. The Global Pension Transparency Benchmark focuses on the transparency and quality of public disclosures relating to the completeness, clarity, information value and comparability of disclosures.
- Completed a strategic review of our operational footprint resulting in the planned closure of our San Francisco office by the end of the calendar year. This decision was the result of a thorough analysis of business activities that best serve our global operations. The San Francisco office was established in January 2019 in pursuit of valuable investment opportunities and deep relationships within the technology ecosystem. We continue to pursue these objectives globally.
Leadership announcements
- Announced the following Senior Management Team appointments:
- Caitlin Gubbels as Senior Managing Director & Global Head of Private Equity;
- Priti Singh as Senior Managing Director & Chief Risk Officer; and
- Heather Tobin as Senior Managing Director & Global Head of Capital Markets and Factor Investing.
- John Graham was appointed the Chair of FCLTGlobal’s board of directors. FCLTGlobal is a non-profit organization, whose members are leading companies and investors worldwide, that develops actionable research and tools to build a long-term sustainable global economy. John has been a member of FCLTGlobal’s board since 2021. CPP Investments is the co-founder of FCLTGlobal having led the joint initiative that created FCLTGlobal in 2016.
Public accountability
- Hosted in-person public meetings in Calgary, Edmonton, Ottawa, Regina, Winnipeg, Halifax, St. John’s, Charlottetown, Fredericton and Vancouver as well as a national virtual meeting. Public meetings are held every two years across Canada, reflecting our continued accountability to the more than 22 million CPP contributors and beneficiaries by providing an accessible forum to ask questions of our senior leaders.
Debt issuance
- Announced the addition of Cedar Leaf Capital, Canada’s first majority Indigenous-owned investment dealer, to our Canadian Dollar syndicate in the bond market.
Transaction Highlights for the YearActive Equities
- Invested approximately C$160 million for a 2.1% stake in Quebecor Inc., a Canadian leader in telecommunications, entertainment, news media and culture.
- Invested C$113 million in Teck Resources, a leading Canadian resource company with a portfolio of world-class copper and zinc operations across North and South America, resulting in a less than 1% stake.
- Invested an additional C$50 million in WSP Global through a private placement to support its acquisition of POWER Engineers, Incorporated. We have been invested in WSP Global, a Canadian-headquartered leading global professional services firm, since 2011 and we hold a 10.3% stake.
- Invested C$178 million in Sabesp, Brazil’s largest sanitation company and one of the largest in the world, serving the São Paulo state, and representing a 1.3% ownership interest in the company.
- Invested an additional C$463 million in Asahi Group Holdings, a Japanese beverage holding company, resulting in a total ownership stake of 1.8%.
- Invested C$133 million for a 0.5% stake in First Solar, a leading photovoltaic solar technology and manufacturing company headquartered in the U.S.
- Invested €600 million through a private placement for a 1.3% interest in the public shares of Denmark-based DSV A/S to support the funding of DSV’s acquisition of Schenker AG. This acquisition enhances the company’s position as a world leading player within the global transport and logistics industry.
- Exited our approximate 6% stake in Delhivery, India’s largest integrated third-party logistics service provider. Net proceeds from the sale were C$298 million. Our initial investment in the company was made in 2019.
- Realized a partial interest of our stake in Viking Holdings for net proceeds of C$2 billion through the company’s initial public offering as well as through subsequent follow-on offerings. Viking Holdings is a global cruise operator and travel company. Our initial investment in the company was made in 2016 and we continue to own approximately 13% of shares outstanding.
Credit Investments
- Invested US$59 million in Spirit Airline’s refinanced Super Class B Enhanced Equipment Trust Certificates. Spirit Airlines is a U.S.-based airline that operates flights throughout the U.S., Caribbean, and Latin America.
- Completed a US$475 million secured term loan and working capital facility to finance a Sixth Street consortium’s acquisition of Select Portfolio Servicing (SPS) from UBS. Founded in 1989, SPS is the leading servicer of non-agency mortgages in the U.S.
- Committed KRW 473.1 billion (C$479 million) in a separately managed account by TPG Angelo Gordon, targeting real estate credit opportunities in South Korea.
- Completed a US$250 million anchor investment in the Antares Private Credit Fund, which holds Antares-originated loans to private companies in the U.S.
- Invested SEK 1.2 billion (C$150 million) in the holding company facilities of Open Infra, a fibre-to-the-home developer, owner and operator across Sweden and Germany.
- Committed approximately C$90 million to a mezzanine forward-flow agreement with HomeTree, a U.K. whole-market energy player. The loan will support HomeTree’s expansion of its solar systems and heat pumps financing business.
- Committed to invest up to £75 million in a mezzanine loan facility supporting ThinCats, an alternative lender to mid-sized businesses in the U.K.
- Invested US$250 million in a loan facility to support CoreWeave, Inc. to purchase contracted Nvidia Graphics Processing Units (GPU) servers for cloud computing. Based in the U.S., CoreWeave provides cloud infrastructure at scale to support artificial intelligence and machine learning workstreams and is one of the largest purchasers of Nvidia GPUs.
- Committed C$185 million in an Indian Rupee-denominated debt facility to Enfinity Global to build 1.2-gigawatts of solar and wind power plants in India. Based in the U.S., Enfinity Global is a renewable energy and sustainable services company with a large portfolio of solar, onshore wind and battery storage assets across the U.S., Europe, and Asia, in various stages of development.
Private Equity
- Invested US$100 million for an approximate 14% stake alongside PAG in the combined company of Manjushree Technopack and Pravesha, creating a diversified market-leading rigid plastic packaging player in India.
- Committed US$200 million to Stone Point Trident X, managed by Stone Point Capital, a U.S.-based private equity firm focused on financial services and related industries.
- Invested US$80 million in Kestra Holdings, which offers industry-leading wealth management platforms for independent wealth management professionals across the U.S., alongside Stone Point Capital.
- Committed US$300 million to Blackstone Capital Partners Asia III, managed by Blackstone Capital Partners Asia, a leading private equity manager focused on control buyout investments in the Asia Pacific Region.
- Completed C$105 million in follow-on investments to FNZ, a global wealth technology platform, as well as an additional US$58 million follow-on subsequent to fiscal year end.
- Invested JPY 11.5 billion (C$105 million) for a 7% stake in Alinamin Pharmaceutical, a Japan-based developer and manufacturer of over-the-counter drug and health supplement products, alongside MBK Partners.
- Committed approximately €460 million for a significant minority stake in Regnology, alongside a new investment made from Nordic Capital XI in addition to its current ownership. Headquartered in Germany, Regnology is a global software provider with a focus on regulatory reporting solutions for financial institutions.
- Invested US$180 million alongside Advent in the take-private of Nuvei, a global payments provider based in Montreal, Canada.
- Invested approximately US$1 billion for a significant minority interest in Novolex to support its combination with Pactiv Evergreen Inc., creating a leading manufacturer in food, beverage and specialty packaging products across North America.
- Completed the acquisition of Keywords Studios, a leading technology services provider to the global video gaming industry, alongside EQT and Temasek. We invested approximately US$515 million for an approximate 24% stake in the company.
- Co-invested US$100 million in Jersey Mike’s, a leading franchisor of fast casual submarine sandwich shops with approximately 3,000 stores across 50 U.S. states and in Canada, alongside Blackstone.
- Completed a disposal and reinvestment of our stake in Nord Anglia Education, generating net proceeds of US$2 billion. We have been invested in Nord Anglia, a leading international school organization, since 2017. Our current ownership stake is 15%.
- Committed US$75 million to Radical Growth I, managed by Radical Ventures, a Canadian-headquartered AI-focused venture and growth manager with offices in Toronto, San Francisco and London, as well as an additional US$75 million to Radical Fund IV subsequent to the fiscal year end. The total commitment now stands at approximately US$280 million across various fundraising cycles since the initial investment in 2019.
- Committed approximately €550 million to acquire an approximate 20% stake in team.blue, a leading webhosting services provider and digital enabler for entrepreneurs and small- and medium-sized businesses across Europe.
- Committed US$450 million to Ontic, a provider of specialized parts and repair services for established aerospace technologies. Ontic is headquartered in the U.K.
Real Assets
- Completed a follow-on investment of INR 20.8 billion (C$346 million) in the units of National Highways Infra Trust (NHIT), an Infrastructure Investment Trust sponsored by the National Highways Authority of India. Since our initial investment in 2021, we have invested INR 57.6 billion (C$960 million) to date.
- Committed €500 million to EQT Infrastructure VI, which will invest in value-add infrastructure opportunities across U.S., Europe and selectively Asia.
- Signed a new 50:50 joint venture agreement with Cyrela Brazil Realty, the largest residential real estate developer in Brazil, with an investment target of R$1.7 billion (C$400 million) to develop residential condominiums in São Paulo, Brazil.
- Signed a joint venture agreement with Equinix, Inc., a digital infrastructure company, and GIC with the intent to jointly raise more than US$15 billion in capital. We have made an initial equity allocation of up to US$2.4 billion and will control a 37.5% equity interest. The joint venture will develop state-of-the-art Equinix xScale data centres in the U.S. to serve the unique core workload deployment needs of the world’s largest cloud service providers, including hyperscalers, which are key players in the AI ecosystem.
- Completed a follow-on commitment of up to R$2.2 billion (C$532 million) to Brazilian water and sanitation company, Iguá Saneamento, to support its business growth related to its new major concession contract in the Brazilian state of Sergipe. We currently own a 66.5% stake in the company.
- Acquired a 12% interest in AirTrunk, the leading Asia-Pacific data centre operator, in partnership with Blackstone, in a transaction that values the business at an implied enterprise value of over A$24 billion (C$22 billion), including capital expenditures for committed projects.
- Committed €500 million to Blackstone Real Estate Partners Europe VII, which invests in under-managed, well-located real estate assets across Europe.
- Entered into a definitive agreement to jointly acquire ALLETE, Inc. alongside Global Infrastructure Partners for US$6.2 billion, including the assumption of debt. Headquartered in Duluth, Minnesota, ALLETE is focused on addressing the clean-energy transition by expanding renewables, reducing carbon, enhancing grid resiliency, and driving innovation. Upon closing, our ownership stake in ALLETE will be 40%.
- Entered into agreements related to our ownership in 407 Express Toll Route (407 ETR), a 108-km toll highway spanning the Greater Toronto Area in Canada. Net proceeds from the applicable transactions are expected to be approximately C$2.39 billion for a net 5.81% sold after closing. We continue to hold a significant interest in 407 ETR.
- Signed an agreement to sell our entire 15.75% stake in U.S. power producer Calpine Corporation to Constellation Energy as part of Constellation’s acquisition of Calpine. As at signing, net proceeds are expected to be approximately US$700 million in cash and US$1.9 billion in Constellation stock. Our original investment in the company was made in 2018.
Transaction Highlights Following the Year-End
- Invested in the loan facilities of Waste Services Group, a waste management solution provider in Australia.
- Invested approximately €275 million in IFS, acquiring shares from EQT alongside other investors. Headquartered in Sweden, IFS is a leading global provider of cloud enterprise software and industrial AI applications.
- Committed to invest in a new wireless network infrastructure subsidiary of Rogers Communications Inc. through a Blackstone-led acquisition of a non-controlling interest in the business unit, subject to closing.
- Completed the sale of a diversified portfolio of 25 limited partnership fund interests in North American and European buyout funds to Ares Management Private Equity Secondaries funds and CVC Secondary Partners for net proceeds of approximately C$1.2 billion. The portfolio of interests represents various primary commitments and secondary purchases made in funds over 10 years old.
- Committed A$150 million (C$135 million) to Pacific Equity Partners PE Fund VII, which focuses on upper mid-market buyout opportunities in Australia and New Zealand.
About CPP InvestmentsCanada Pension Plan Investment Board (CPP Investments™) is a professional investment management organization that manages the Canada Pension Plan Fund in the best interests of the more than 22 million contributors and beneficiaries. In order to build diversified portfolios of assets, we make investments around the world in public equities, private equities, real estate, infrastructure and fixed income. Headquartered in Toronto, with offices in Hong Kong, London, Mumbai, New York City, San Francisco, São Paulo and Sydney, CPP Investments is governed and managed independently of the Canada Pension Plan and at arm’s length from governments. At March 31, 2025, the Fund totalled $714.4 billion. For more information, please visit www.cppinvestments.com or follow us on LinkedIn, Instagram or on X @CPPInvestments.
Earlier today, I had a conversation with CEO John Graham going over CPP Investment's fiscal 2025 results.
Before I get to that conversation, I'd like to go over over a few items in the Annual Report 2025.
This isn't an easy report to read quickly, you need to take your time to read it carefully but it's packed with information, lots of great information.
Below, I refer you to the table of contents of the Annual Report:

As always, I recommend you read Chairperson Dean Connor's report on page 2 and CEO John Graham's message on page 4.
In order to keep this post tight, I am going to jump into some highlights and things that caught my attention.
First, FY 2025 was a very good year for the Fund as it delivered a 9.3% net return:

So what are the key things to note as you read the annual report?
First, look at key performance indicators over the short and long run:

Nonetheless, over the last 5 years, Base CPP underperformed its new benchmark portfolio 0.7% (typo in annual report which states 0.8%) and Additional CPP underperformed its new benchmark by 0.3% over that period.
The press release above states:
In fiscal 2025, the benchmark portfolios replaced the market risk targets (previously known as the reference portfolios) as our benchmark against which relative performance is measured. The benchmark portfolios provide target allocations for our active and balancing investment strategies. We construct the benchmark portfolios by aggregating the public market index benchmarks that serve as passive, investible alternatives for each individual investment strategy.
Prior to the introduction of the benchmark portfolios, the market risk targets served as both our performance benchmark and a representation of our targeted level of market risk. Over time, however, the market risk targets became less aligned with the targeted exposures of our investment portfolios. During the first era of active management, the composition of the reference portfolio matched that of the base CPP investment portfolio. Over time, the development and growth of a multi-strategy platform made the reference portfolio significantly less diversified than a sophisticated global portfolio that is representative of CPP Investments’ statutory mandate, rendering it an inadequate measure of performance today. The benchmark portfolios better reflect our diversified investment approach and long-term strategy, offering performance benchmarking that is more relevant and accurate today as an alternative passive strategy to the investment portfolios compared to the earlier era.
Basically, if CPP Investments stuck with its old reference portfolio of 85% MSCI Global Equities/ 15% Canadian bonds, it would have severely underperformed on a relative basis but that old benchmark/ reference portfolio does not accurately reflect the diversification of its multi strategy platform.
I always knew there would be a day where they'd drop that benchmark because it's truly a silly benchmark which does not reflect the risks and diversification of the underlying portfolio.
So what are the new benchmarks? Below, you can see them for individual asset classes and their weighting for base and additional CPP:

And here is how they set these benchmarks:

Benchmarks are important to gauge relative performance but as you will see from my discussion below with John Graham, they are far from perfect, especially in Private Equity where a big chunk of the total assets reside:

Now, as far as individual asset class performance, here it is along with the annualized net returns by geography:


Below, some details on the individual investment departments and their performance in FY 2025:
- Total Fund Management: In fiscal 2025, TFM gained 7.2%, mainly driven by the positive
impact of foreign exchange movements and the performance of public equities (mainly US equities). Over the past five years, TFM delivered a net return of 5.2%, up from 4.7% in the prior fiscal year. Benchmark returns are not presented for TFM because its primary purpose in investing in the Balancing Portfolio is to rebalance the total portfolio to deliver the Fund’s targeted exposures. This is in contrast with other investment departments whose primary purpose is to deliver investment selection value add as outlined on page 20. - Capital Markets and Factor Investing: In fiscal 2025, CMF delivered net income of $1.2 billion, driven largely by the performance of external hedge fund managers, with additional gains from internally managed strategies. Most hedge fund strategies achieved gains, with the largest contributions coming from quantitative equity and multi-strategy managers. Hedge fund performance was particularly strong in the third quarter of our fiscal year, as managers successfully positioned portfolios through the U.S. election cycle. CMF’s internally managed strategies delivered positive returns driven by quantitative equity. This was partly offset by strategies that focus on foreign exchange, fixed income, and commodities. Performance within the quantitative equity portfolio was broad- based across all factors, including momentum, growth, capital flows, and quality.
- Active Equities: In fiscal 2025, AE earned net income of $0.8 billion due to gains from the developed market program. North America was the primary contributor, while Europe ended the year flat. In North America, gains were diversified across media, communications, technology and financials investments. Emerging markets remained challenging this year, with losses in Brazil detracting from overall results. Fiscal 2025 was a difficult year for active investing in Brazil, given its high interest rates, increasing inflation expectations and a depreciating currency. Asia contributed a small gain this year.
- Credit Investments: In fiscal 2025, CI’s net return of 16.5% was primarily due to income earned, continued gains from the tightening of credit spreads and foreign exchange gains. Antares Capital, CI’s middle-market private financing platform, was a significant contributor to the fiscal 2025 results due to positive operational performance in its lending division and the persistent higher interest rate environment. The U.S. dollar, which represented the majority of the portfolio’s currency exposure, appreciated against the Canadian dollar, further contributing to the positive performance. This year’s performance was higher compared to fiscal 2024. The performance in fiscal 2024 was mainly driven by European
investments and Antares Capital. - Private Equity: In fiscal 2025, PE’s net return of 8.7% was driven by externally managed investments, particularly in the U.S. PE’s private portfolio companies in the consumer discretionary and health care sectors delivered earnings growth through improvements in operational results that contributed to returns. The U.S. dollar, which represented the majority of the portfolio’s currency exposure, appreciated against the Canadian dollar, further contributing to returns. This fiscal year’s performance was lower compared to fiscal 2024. Fiscal 2024 performance was driven by gains predominantly in the technology, healthcare and financial sectors and slightly offset by foreign currency losses, primarily attributable to the depreciation of the euro against the Canadian dollar.
- Real Assets: RA’s net return of 8.7% in fiscal 2025 reflected positive results across the portfolio. RA had broad-based gains in sustainable energies, particularly in Canada and the U.S., which benefited from growing energy demand particularly in the power generation sector. The infrastructure portfolio delivered gains through investments in U.S. telecommunications, toll roads in Canada and port services in the U.S. and U.K., which benefited from increased economic activity levels. The real estate portfolio delivered lower relative performance as investments in the office and retail sectors continued to be negatively impacted by higher interest rates, e-commerce and hybrid-working trends. However, the portfolio benefited from double-digit returns in data center investments. This fiscal year’s performance was higher than fiscal 2024, when the portfolio was negatively impacted by foreign currency losses
Now, in terms of relative performance of some asset classes (relative to the new benchmarks), the report provides them over a longer 5 and10-year period for the private ones where active management takes place. For example:
- Credit Investments: Over the past five years, CI delivered a net return of 10.2%, an
increase from the prior five-year period as a result of double-digit returns in fiscal 2025 and the rolling off of fiscal 2020 results which were adversely impacted by the COVID-19 pandemic market environment. CI’s absolute results over the five-year period were mainly driven by the post-pandemic recovery in demand for asset backed and financial credit, sustainable energy loans, as well as European liquid credit investments. Over the same period, CI generated net value added of 2.1% above its benchmark, excluding the impact of foreign currency. This represents an increase of 0.1% compared to the prior five-year period. Net value added over the five-year period was mainly driven by corporate and opportunistic credit as well as sustainable energy loans that have outperformed the benchmark. Over the past 10 years, CI delivered a net return of 9.1% with a net value added of 3.2% above its benchmark, excluding the impact of foreign currency. CI’s incremental returns reflect its underwriting discipline and the benefits of CPP Investments’ strategic relationships with investment partners. - Private Equity: Over the past five years, PE delivered a net return of 14.7%, an increase from the prior five-year period. The increase was driven by positive net returns in fiscal 2025 and the rolling off of fiscal 2020 between the comparative periods. PE’s externally managed fund investments, and direct assets in the information technology, financials and consumer discretionary sectors contributed to its absolute results over the five-year period. Over the same period, PE generated a net value added of negative 5.5% against its benchmark, excluding the impact of foreign currency, which was lower than the previous five-year period. This was primarily due to the rolling off of fiscal 2020, where PE delivered double-digit positive net value-add above its public market index benchmark during the COVID-19 pandemic market downturn. Over the past 10 years, PE delivered a net return of 13.5%, with a net value added of 2.6% above its benchmark, excluding the impact of foreign currency. The department’s access to the full value chain in private equity globally, scale to compete at the larger end of the direct market, well-developed relationships with general partners, and investment selection positively contributed to its results over the 10-year period.
- Real Assets: Over the past five years, RA delivered a net return of 7.0%, an increase from the prior five-year period, which was driven by positive net returns in fiscal 2025 and the rolling off of fiscal 2020 between the comparative periods. RA’s investments across real estate, infrastructure and energy all contributed positively over this period. This result was largely attributable to increases in energy and commodity prices as well as the performance of industrial assets and transportation infrastructure. Over the same period, RA generated net value added of negative 0.8% against its benchmark, excluding the impact of foreign currency. This represented a decrease compared to the prior five-year period, mostly due to the performance of the real estate portfolio compared to its benchmark, primarily impacted by adverse market conditions in office and retail sector during the COVID-19 pandemic period. Sustainable energies performance remained above its benchmark with key contributions from power and upstream energy investments. Infrastructure portfolio performance was also above its benchmark driven by toll road investments in both developed and emerging markets. Over the past 10 years, RA has delivered a net return of 6.9%, with net value added of 2.2% above its benchmark, excluding the impact of foreign currency. Positive results above the benchmarks were achieved across all of RA’s portfolios, with sustainable energies as the largest contributor, followed by infrastructure and real estate.
Alright, a lot of information to digest but it's critically important to understand why new benchmarks were adopted and why it's important to look at relative performance over a longer period.
In terms of absolute performance, CPP Investments had a great fiscal and incredible calendar year and that's why the Fund was ranked among the world's top-performing pension funds again this year.
CPP Investments consistently ranks among the world’s top-performing pension funds. Learn more about how its long-term performance has been previously recognized by Global SWF (caveat: always bear in mind their asset mix is different and that explains a lot of the outperformance but so does active management).
Discussion With John Graham, CEO of CPP Investments
As I stated above, earlier today, I had a conversation with CEO John Graham going over CPP Investment's fiscal 2025 results.
I want to thank him for taking the time to speak with me as I always enjoy our conversations and I also want to thank Frank Switzer for setting up this call and providing me material to review beforehand.
John began by giving me an overview of fiscal year 2025 results:
9.3% return, just under $60 billion net investment income. I would describe the year as a strong year and as a year where the portfolio performed as expected. It largely did what we thought it was going to do through the year.
Going through the different asset classes, I'd say Credit and our Capital Markets and Factor Investing which is our hedge fund group. They had very strong years where they delivered strong returns.
Credit certainly benefited quite a bit from the US dollar appreciation relative to the CAD. Private credit continues to be a US dominated market, there's some Europe but tends to be a USD heavy market. So Credit had a good year but also benefited from currency -- the USD appreciation.
Public Equities continued to have a strong year, especially US public equities.
Looking at some other groups, I'd say our Real Assets group. Energy had a strong year, especially our conventional energy, oil and gas pipelines, that continued to perform well. Infrastructure had a good year, a solid year, some assets like the 407 continued to perform really well. Real Estate was slightly up and I'd describe it or the way I look at it, I think our RE portfolio has caught its footing over the past year or two. We certainly historically took some lumps on retail and office. But over the past year the portfolio has stabilized and gained especially in Asia.
Private Equity, it had a good 5 years from a total return perspective but as you know we are not seeing the transaction activity we've seen historically that's been a little bit of a headwind into the market.
From a geography perspective, US through the fiscal year, it's changed a little bit post fiscal year end. US was strong. Canada was good, there's a bit of an asset mix, if you see the Canadian numbers, we have a lot of Canadian fixed income. And then every other geography contributing positively.
When I look at the portfolio, most important thing is it performed as expected. We benefited from currency and then all the different departments chipping in to the return.

I told John the portfolio indeed performed as expected last fiscal year as diversification kicked in but also noted that I read this in the annual report: "Private equities generated a five-year net return of 15.7%, and contributed to 48% of the Fund’s total returns. Public equities generated returns of 11.3%, or 35% of total returns."(page 36)
I said that Private Equity is an important asset class, it will always remain an important asset class but I don't see the bulk of the returns coming from there again over the next five years given the headwinds there (things can change abruptly).
John responded:
Private Equity, we have high expectations of return because of the nature of the asset class. If you look at the portfolio, you'd expect Private Equity to punch above its weight based on the return expectation.
A couple of comments. We would expect the contribution to the portfolio to be a little bit in excess to the allocation of the portfolio so that 48% number you mentioned, that's not the expectation going forward.
I think one thing we believe -- and we talked about this last year -- beta returns are gong to be harder to get going forward. Total returns will rely more on alpha going forward. We are just going to have to fight for every bit of return going forward. And when I think where it's going to come from, we continue to be big believers in diversification and we would look at every asset class to chip in to return largely in line to our allocation to them.
I'm glad he mentioned that beta returns are going to be harder to come by in the future because I covered critics of CPP Investments' approach and wanted him to discuss the change in benchmarks and how they respond to underperforming their benchmark portfolio over the last five years on a relative basis (see my discussion above).
He responded
I don't know if you have the annual report in front of you (I did), on page 39 it shows the waterfall:
This is how I think of the investment framework. If you look at the left-hand side of the waterfall, you see the minimum level of market risk, essentially the minimum return portfolio. That we build out of the real return the Chief Actuary publishes. That gives a real rate of return related to the sustainability of the CPP.Then the organization makes a series of decisions to get to the investment portfolio. We make a decision on how much risk and exposure to take which are actually the same decision because can't dissect the two. That tells us how much diversification we want and how much risk we want and that takes us to the benchmark portfolio.
And the benchmark portfolio is actually the portfolio of the 2100 people here because it's the aggregate of our asset class benchmarks and then we look at performance against that benchmark portfolio.
I know there's a real desire in this industry to reduce performance to one number and that's usually relative performance to benchmark but it's more complicated than that.
Let's start we the reference portfolio. To me the reference portfolio is not a resilient portfolio, it's highly concentrated into a few stocks, the US accounts for 70% of the global capital markets. So from a reference portfolio, we'll have a high concentration of US and then we'll have a high concentration there of the Magnificent Seven in it.
For a pension plan, for an organization that's there to deliver on the pension promise, I don't believe that's an appropriate portfolio nor do I believe anyone would hold it to deliver on the pension promise.
So I look at our performance relative to the minimum level of market risk and that allows me to understand if adding more risk and diversifying the portfolio, did that add value?
Those are mini beta points of exposure, we can look at that and say what cost did we incur to pick up those basis points of return. Then going from the benchmark portfolio to the total fund, that's security selection and that's where a lot of the cost is incurred from there so I think it's very appropriate to measure performance against that because that's where the effort and cost is being spent, and we need to incentivize, reward and motivate people to beat that.
So if you look over the past 5 years, you can see we underperformed the benchmark portfolio by 70 basis points. Over the past 10 years, we outperformed it by 140 basis points, and we outperformed it 6 out of the last 10 years. With the amount of tracking error we take, I don't expect to beat it every year but I do expect to beat it over the long run.
I think what's important over the last five years is the portfolio underperformed the benchmark portfolio because of decision we made. The biggest source of underperformance is because the Private Equity portfolio is largely a mid cap portfolio and it's US centric too, and it's benchmarked against a levered public equity large cap index. So it's benchmarked against a levered S&P 500 and you're not going to be invested in mid caps and beat a levered S&P 500 especially with what has happened with the Mag-7.
But when I look at the performance, that was a deliberate decision. We don't think we should have that level of concentration in a handful of companies and for a pension plan, who we are and what our identity is -- we are not a wealth maximizing vehicle -- we are a pension plan that is there to make sure every week or month or biweekly when money is taken off a Canadians' cheques, in return they get a promise that when they retire they have a benefit that they earned every dollar of for the rest of their life and protect it against inflation. And our job is to build a portfolio and make sure that promise is kept.

That ladies and gentlemen concludes Part 1 of my 30 minute discussion with John Graham.
It's late, my wife and child are sleeping and I want to relax a bit bore hitting the sack.
I will come back tomorrow to complete this post with the rest of my discussion with John since he's heading up Canada's largest and most important pension fund.
Part 2 of my Discussion With John Graham
Alright, let me continue this discussion exactly where I left it off.
I noted that Private Equity underperformed its benchmark by 5.5% over the last 5 years (outperformed it by 2.6% over a 10-year period) and critics will question why invest in private equity that focuses in mid caps.
Above that, one of the issues I found covering the Maple Eight is they all have a private equity benchmark problem because the benchmark is typically S&P 500 plus a spread and that does not reflect the underlying portfolio.
I asked John if there was a discussion about this at the Board level because it could be a problem.
He replied:
As I said, the way we benchmark private equity is using a levered S&P 500 against what is essentially a mid cap business.There's a sidebar there, going long mid cap and short large cap.
I think what's an interesting discussion is whether or not people still believe that size is a factor that pays or have we evolved into a world where winner take all where size/ scale dominates over small caps.
And that's why as I think about performance, it's almost a balanced scorecard approach of looking at the absolute return, doing attribution and understanding where every basis point is going and understanding are these deliberate decisions being made.
You know this as well as anybody, in this industry, an inordinate amount of time goes into trying to push down benchmarks. And at the end of the day, that doesn't actually create value.
What creates value is absolute returns.
Correct! On alpha, I asked John what decisions are being made at Total Fund Management to create alpha and he responded:
Very few. In general, most of Total Fund Management, our expectation is they are really there managing the Balancing portfolio.
We have a portion of the portfolio that is passively invested and we use that to balance exposures from the active portfolio and to make sure we are at our right level of Equity and Fixed Income.
So most of what TFM is doing is rebalancing the portfolio toward desired exposures and the expected alpha of those rebalnces is zero.
They're really meant to be a little bit programmatic in rebalancing the portfolio.
In other words, it's mostly about rebalancing, not about taking a massive tactical asset allocation decisions on bonds and stocks to add alpha (as John stated, expected alpha is zero for TFM).
I told John that deal transactions have fallen off a cliff this year and I know this because I cover the Maple Eight and it's been very slow, with very few deals far and in between.
I asked him straight out: "What's going on, why aren't there more deals? Are people waiting for a catalyst in the form of a big event?"
He responded:
Yeah, good question. We came into the year and especially in North America, animal spirits were running wild. People thought 2025 was going to be the year of the deal. Those animal spirits are pretty silenced right now, markets feel delicate at best.
Transaction volume has been muted especially in the private equity space. It hasn't been great for a few years now. There was a lot of activity at the tail-end of Covid and has been softer for the past 2-3 years.
For us, it's ok, we are well capitalized, we have lots of liquidity, we don't look to our private assets for liquidity but the lack of distribution is problematic especially for some institutional investors.
Transaction activity is low, especially North America, but we still see opportunities around the world. It's probably a little bit better in Europe and Asia than it is in North America.
You asked about catalysts. Right now as you know volatility, uncertainty, nobody knows where things are going to land. Investors sit on their hands in times like this and until we get a little more clarity on where things will land, I think we should expect things to continue this way.
Since John is a credit expert, was in charge of Credit Investments prior to being named CEO, I shared my bias and told him everyone is still waiting for a catalyst there meaning a US recession, noting if we avoid one, credit should continue to do well. However, if we don't avoid a recession, I expect a lot of the newer Johnny come lately private credit funds that were taking stupid risks using flimsy underwriting standards will get dinged hard.
He responded:
Everyone is always waiting for the credit market to crack but it's probably a little more complicated in some ways.
On the positive side, if you think about the returns people have had over the last few years building on our previous discussion, at least there has been DTI (distribution to investment), at least people have been taking money off the table in credit. It's probably one of the few asset classes that has been producing good distributions back to LPs.
The games in credit tend to be yield. You're getting your basis. Now, within the credit markets, I think it's going to be obviously very dependent on where people are playing in the credit markets. Have people decided to stay in the senior secured, first lien sponsored back market or has there been a drift into junior capital, a drift into hybrid capital, a drift into other more equity-like parts of the market?
As we know, you think about the capital structure, if you're in senior secured, you"re the last one to lose money, everyone else has to be impaired before you lose money. If people started to drift up the risk spectrum in credit to chase yield, that's where you need to be concerned but people have stayed largely still in senior secured. The pain is going to be felt in other parts of the market before it's felt there.
Now, you always have to be worried with the amount of capital that has been raised in the credit markets on how that's being deployed but right now some of that private credit is displacing the bank lending markets, so it's not necessarily bringing in the marginal borrower, it's displacing the historical lender.
I told him I see funds like Apollo, Ares and other top alternative funds raising billions in credit, specifically in private credit and it does worry me as it might impact returns going forward but if you heard their leaders, they're not worried and think explosive growth is only starting there.
John shared these insights:
First thinking about the more traditional sponsor-backed finance market and there I really think there is a symbiotic relationship between bank market and private lenders where the banks really want the client and all the other business from the client but they don't want the asset because of the capital charge whereas the private lender wants the asset (ie. the loan), often non-investment grade rated but it doesn't want the client, only the asset. So there's quite a symbiotic relationship in some of the more traditional leveraged finance market.
Certainly an area of growth -- and this is not my area of expertise -- has been private credit into the investment grade space. This is where you have the involvement of the insurance companies partnering with private credit and that's not something we've done or participated in as we stay away from private investment grades as part of our mandate. But that is where people see the explosive growth.
When you get into investment grade, the risk premium is just not very big so how you end up delivering good returns is always a question after fees and leverage.
As final thoughts, I asked John what he's most proud of in fiscal 2025 and he shared this with me:
I look at fiscal 2025 but again, in this business what does a year mean? Looking at the 10-year return, 8.3%, the longer term number and what I'm most proud of, out of the $714.4 billion that we manage, $492 billion comes from investment income. That's investment income that has been generated through the activities of CPP Investments by investing the capital all over the world. That's $492 billion that comes back into Canada to pay the pension benefits of 22 million Canadians, contributors and beneficiaries.
Now, over the last year, for the organization and what I'm most proud of and we touched on this, even coming up to today, it's been a bit of a wild ride. There's been a lot of uncertainty even in the elections in November, this time last year there was uncertainty, it's been a bit of a wild ride.
And when you're managing the scale of the capital we manage, you can't over-steer this portfolio. You've got to be calm, you've got to be patient, you've got to be long-term and you can't lose your conviction. And all the way from the Board, to senior management to the organization, through Liberation Day, through all the noise in the market, the organization never panicked and the portfolio performed as designed.
I call the portfolio a super tanker. What I mean by that is the portfolio is designed to be the best portfolio through a wide range of macroeconmic outcomes. It's not going to be the best portfolio in any one regime, whether that growth up, growth down, stagflation but through them all it will be the best portfolio. Because at $714 billion going to a trillion, you have to build resilience, you have to build sustainability into the portfolio.
I looked across the 2100 people that work here and they didn't get distracted, they didn't sit on their hands, they actively managed the portfolio. You would have seen us do a few sales that we're really proud of. We were able to manage the portfolio really well, transaction volume might have been a bit lower but the teams were super active in upgrading and hydrating the portfolio.
Look, I've been proud of with all the noise and uncertainty out there, the teams just stayed focused and I think the portfolio today is even better than the one we started the year with.
We left it on that note and once again I thank John Graham for another enlightening discussion, one of my best ever on Pension Pulse as we covered a lot of breadth and depth on the CPP Fund and why it's in excellent shape to withstand anything that comes its way.
I was going to also cover risk management and compensation but I will leave that for another post where I cover all of the Maple Eight's compensation disclosures.
Speaking of compensation, I work hard to bring all of you great insights on pensions and investments and want to thank those of you who contribute annually to support my activities.
You simply will not find these type of in-depth interviews with CEO and CIOs of large pension funds anywhere else and I thank the people who take the time to talk with me.
Alright, let me end it there but before I end it, just to let you know of a couple of clips worth watching.
First, a conversation between Jon Webster, Senior Managing Director & Chief Operating Officer at CPP Investments and Michelle Gronning, Global Chief Transformation Officer at PwC Canada where he shares his insights on how organizational transformation needs to be laser-focused on outcomes.
I embedded that below at the very end.
Next, you have to watch NBIM CEO Nicolai Tangen's fantastic Commencement Speech at Wharton which he posted on LinkedIn here. When it becomes available on YouTube, I'll embed it below.
Below, the CPP Fund increased by $82.1 billion, ending the fiscal year at $714.4 billion in net assets. Watch this video featuring CEO John Graham and others to learn more.
Also, John Graham, President and Chief Executive Officer of the CPP Investment Board joins Amanda Lang on Taking Stock to discuss the Fund's results.
Third, Liz Ann Sonders, Charles Schwab chief investment strategist, joins 'The Exchange' to discuss the US deficit, the equity market and more. She explains why the bond market is in the driver seat for the equity market.
Fourth, Vincent Deluard has accurately and consistently described in real time the paradigm shift that has taken place in markets in recent years and how it affects the major asset classes that matter most to investors. His macro calls on things like the trends in inflation and the economy have not only been out of consensus, they’ve been unusually accurate. In this discussion with Jesse Felder, Vincent shares the fundamentals of his unique approach to macro analysis and how he is putting it to best use today to make sense of the rapidly changing economic environment.
Lastly, CPP Investments' Chief Operating Officer Jon Webster discusses organizational transformation with PwC's Global Chief Transformation Officer Michelle Gronning. Great discussion, well worth listening to his insights.
Comments
Post a Comment